Article
14 min read
The global talent map: Where high-skilled workers move and what they earn

Author
Lauren Thomas
Published
June 02, 2026


Key takeaways
- International hiring isn't cost arbitrage: Visa holders earn more than local workers in comparable roles across every major market analyzed – and they're younger, making the premium more striking.
- India dominates global talent flows: Indian nationals are the largest source of H-1B visa holders in the US, UAE Golden Visas, and UAE standard employment visas, and rank second on UK Skilled Worker visas (after the US) and EU Blue Cards (after Russia).
- Foreign workers move twice as often but half as far: In both the US and the UK, foreign workers are twice as likely to move as locals, but their moves average 10 miles in the US versus 18 miles for Americans, and 5km in the UK versus 9km for Brits.
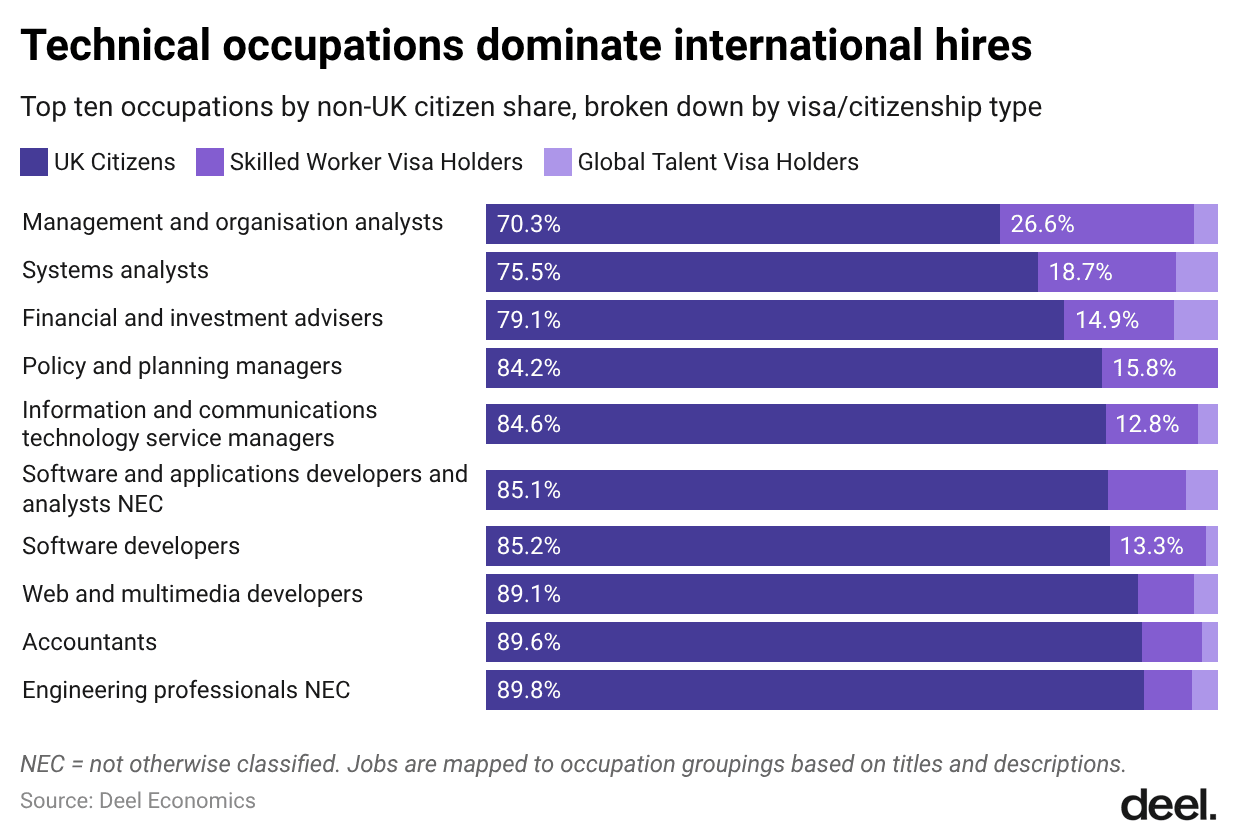
- Tech = visa holders, sales = locals: Software developers make up 23% of UK Skilled Worker visa holders, while 99% of sales professionals are local citizens, a pattern that holds across both the US and UK.
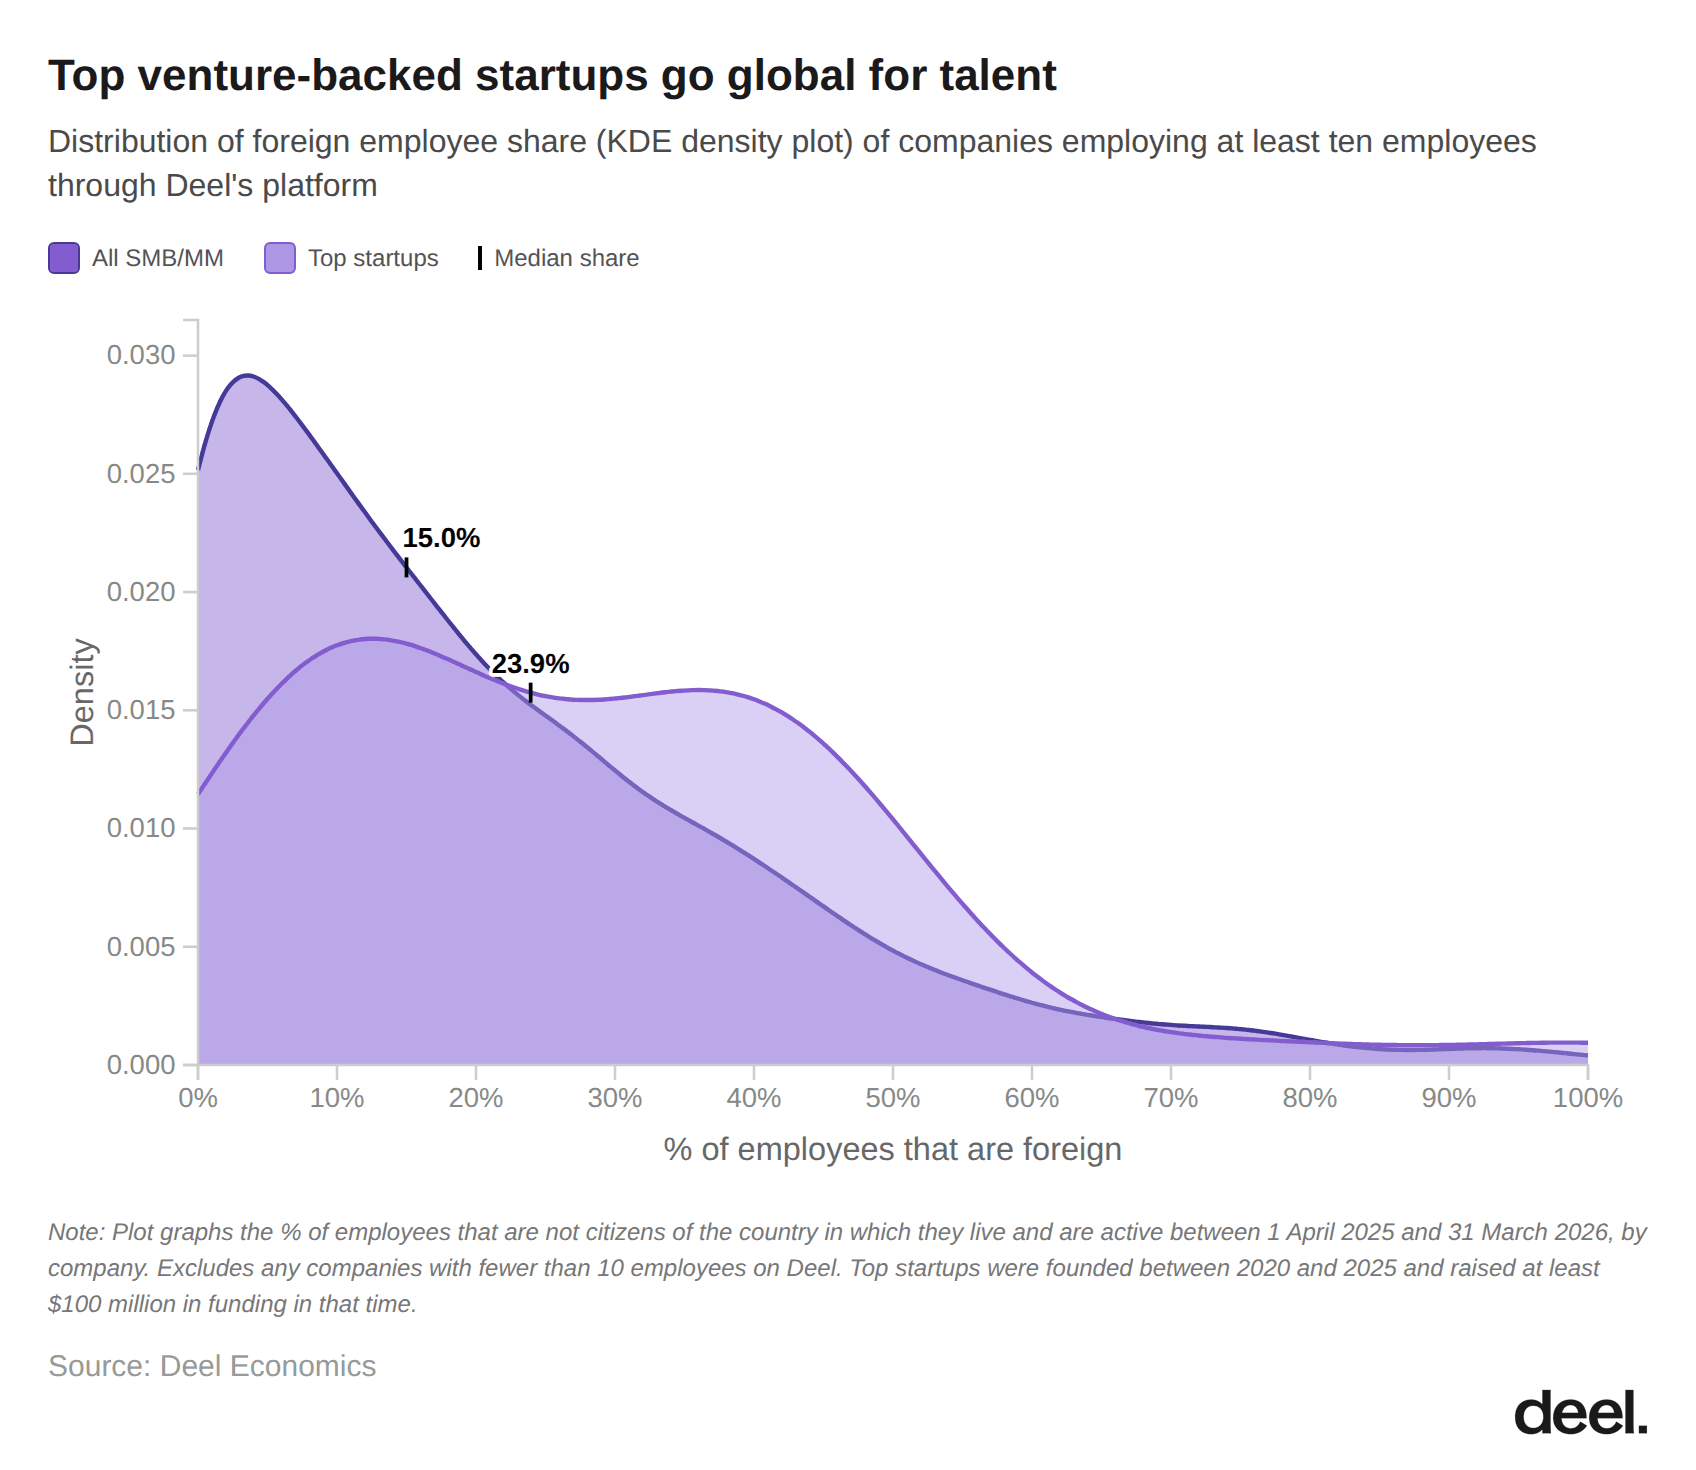
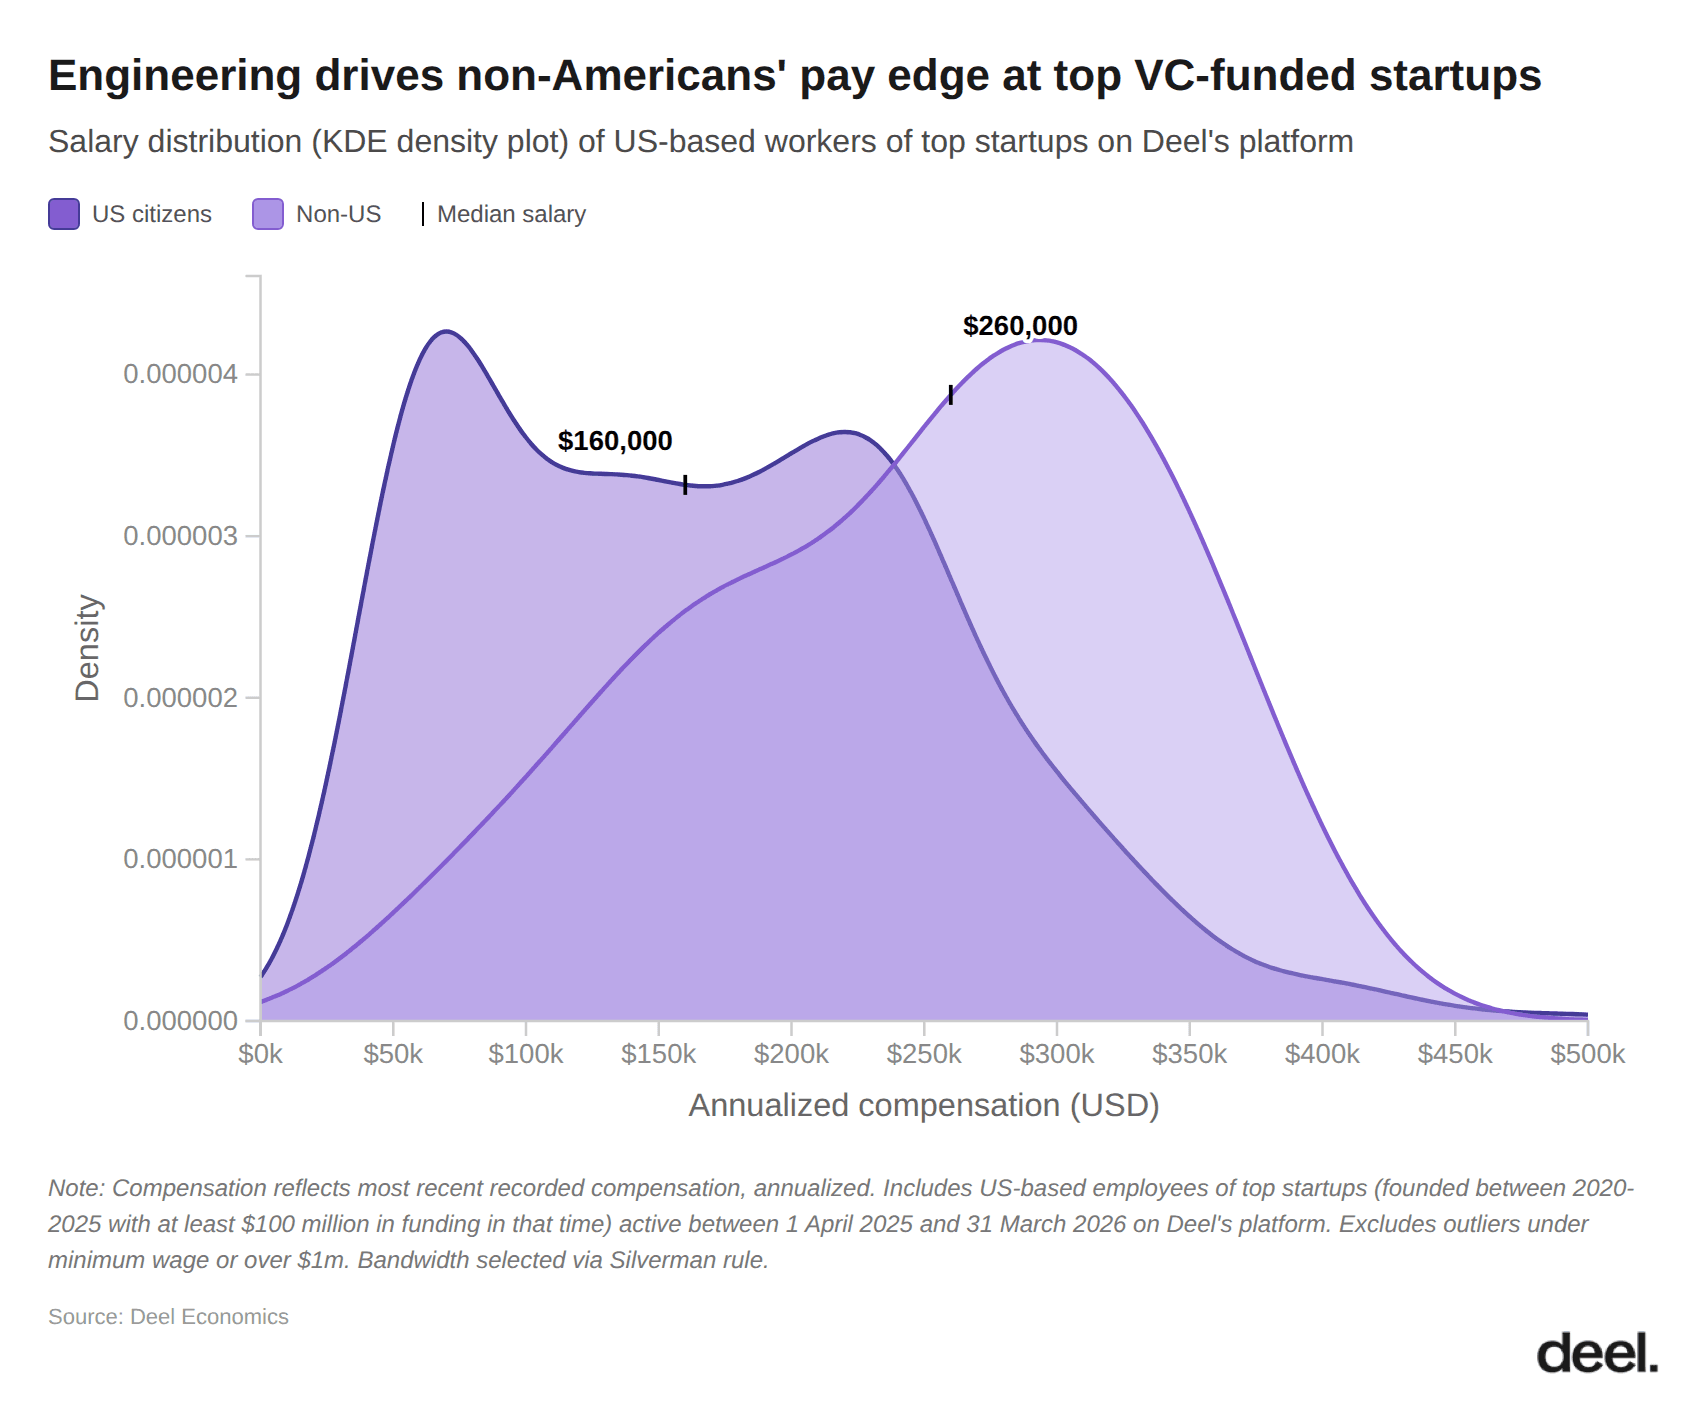
- Top-funded startups go global for talent: 23.9% of workers at top venture-backed startups are foreign, vs. 15% at SMBs. At US top startups, foreign workers earn a median of $260k. That’s $100k more than Americans, driven almost entirely by AI engineering concentration.
In September 2025, the US raised the H-1B filing fee to $100,000, then restructured the lottery in February 2026 to favor high-salary applicants. Other governments, including Canada, the UK, Germany, and the UAE, moved quickly to make their own high-skilled visa programs more attractive. This data looks at the impact, showing where talent is going and what it’s earning when it gets there.
What it shows runs against the conventional wisdom about international hiring. Companies don't hire across borders to save money; they do it to access talent they can't find locally. And they often pay a premium for it.
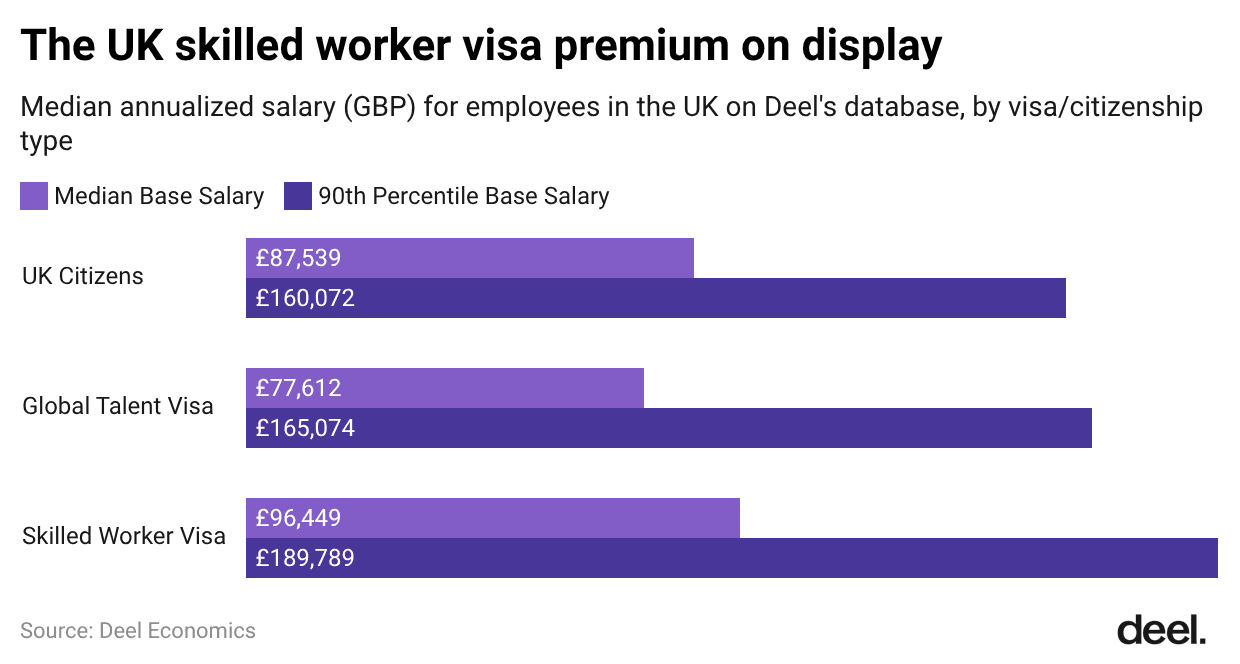
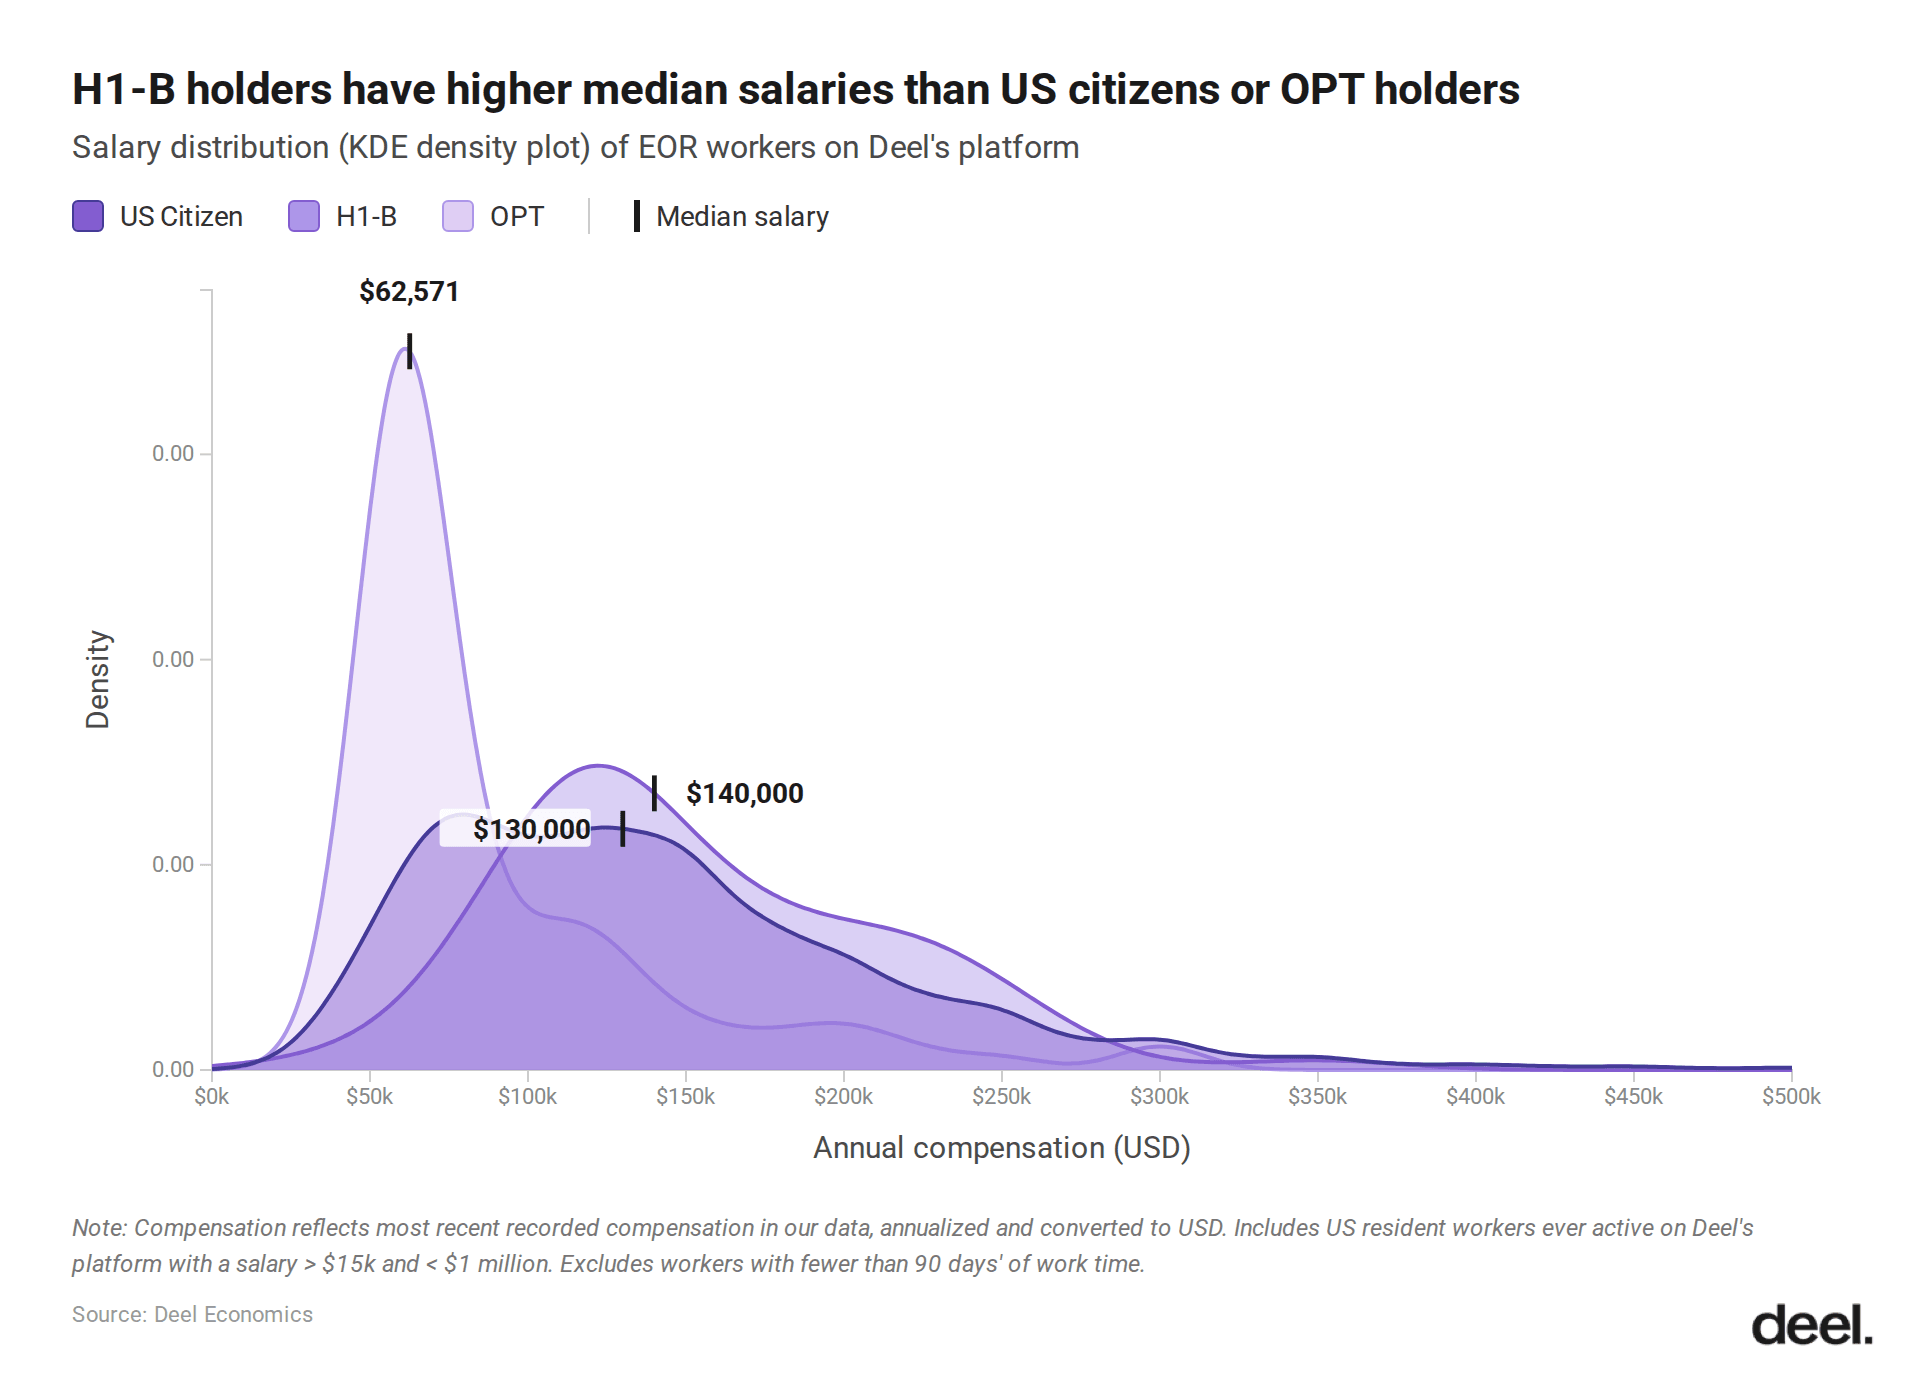
Analysis of salary data from Deel's platform, which covers 40,000+ companies hiring across 150+ countries, shows that visa holders out-earn local workers in comparable roles across major markets. In the UK, Skilled Worker visa holders earn a median of £96,000 compared to £87,000 for UK citizens in similar positions, despite being four years younger. In the US, H-1B workers earn $140,000 versus $130,000 for citizens, at a median age of 31.5 versus 37. In the UAE, Golden Visa holders earn 605,000 AED compared to 459,000 AED for standard employment visa holders.
This reflects selection, as visa processes filter for skills in short supply, and the workers who clear the bar command higher pay because they fill roles local markets cannot. The question is, where are these workers going, and what does their movement reveal about the map of global talent in 2026?
The occupational divide: Why visa holders earn more
The salary premium, essentially, is about where visa holders concentrate. Software developers make up 13% of UK Skilled Worker visa holders. In the US, engineers and technical roles are dominated by visa holders. Meanwhile, sales and creative positions – which require local market expertise – are filled almost entirely by local citizens. Over 99% of salespeople in roles on Deel's platform are local citizens – American in the US, and British in the UK (note: this number excludes non-visa holding non-citizens).
This occupational sorting explains the age gap. H-1B holders skew heavily toward software development roles that big tech sponsors rapidly, whereas OPT visa holders (recent graduates on post-study work permits) cluster in product and research engineering – roles that typically require master's or PhD qualifications and represent the natural exit from advanced engineering degrees. The median OPT worker is 26 years old and earns $62,571, reflecting entry-level roles at companies with slower sponsorship patterns, such as industrial firms, biotech, and hardware startups.
When comparing software developers and data scientists specifically, an apples-to-apples comparison, H-1B holders earn a median of $160,000, versus $154,000 for US citizens and $104,000 for OPT workers. The UK shows an even starker gap: software developers on Skilled Worker visas earn just over £112,000 compared to UK citizens on a median of £93,808 in the same roles.
Technical skills are portable, but creative and sales expertise is not. That's the fundamental divide shaping who moves where.
Top-funded startups go global for talent
The pattern intensifies at the top of the venture-backed market. Top-funded startups – the same list of companies we analyzed in the Global Hiring Report, founded between 2020 and 2025 with at least $100 million raised in that time – hire foreign workers at a markedly higher rate than other Deel customers. The median foreign employee share at top startups is 23.9%, compared with 15% for SMB/MMs and 14.9% for enterprises overall. The pattern holds when we restrict the analysis to tech-only companies (26.3% vs. 16.1%), to EOR employees only (27.3% vs. 18.8%), and to EOR employees at tech companies (29.8% vs. 21.3%).
The gap is geographically uneven. Among UK-based employees, top startups have a foreign share of 33.3% versus 23.2% at SMB/MMs. In the US, the rates are 8.9% versus 4.8%. Both gaps are large in proportional terms, but the absolute foreign share is much higher in the UK, regardless of company stage.
Engineering drives the US pay gap
At US-based top startups, foreign workers earn a median base salary of $260,000. That’s $100,000 more than the $160,000 median for American workers. The gap is driven almost entirely by occupational concentration in high-paying technical roles. Half of all AI engineers working in the US for top startups on Deel's platform are non-US citizens. AI research and engineering is the single most common role for foreign workers at top US startups: 55.8% of them work in that category, compared with just 4.3% of US citizens at the same companies.
Top startups are sourcing the technical talent their local pipelines cannot supply at the scale they need. The pay reflects scarcity rather than savings.
The UK pattern is different
UK-based top startups tell a different story. Foreign and British workers earn roughly comparable median salaries (£126,000 vs. £130,000) and hold broadly similar roles. AI engineering concentration exists, but it is much less pronounced: 18% of foreign workers at top UK startups are in AI engineering, versus 6% of UK citizens.
The gap shows up in age and at the top of the distribution. Foreign workers at top UK startups are younger (median 32 vs. 36), and among workers in their twenties the salary gap widens sharply: non-British employees earn a median of £124.6k versus £96k for British counterparts.
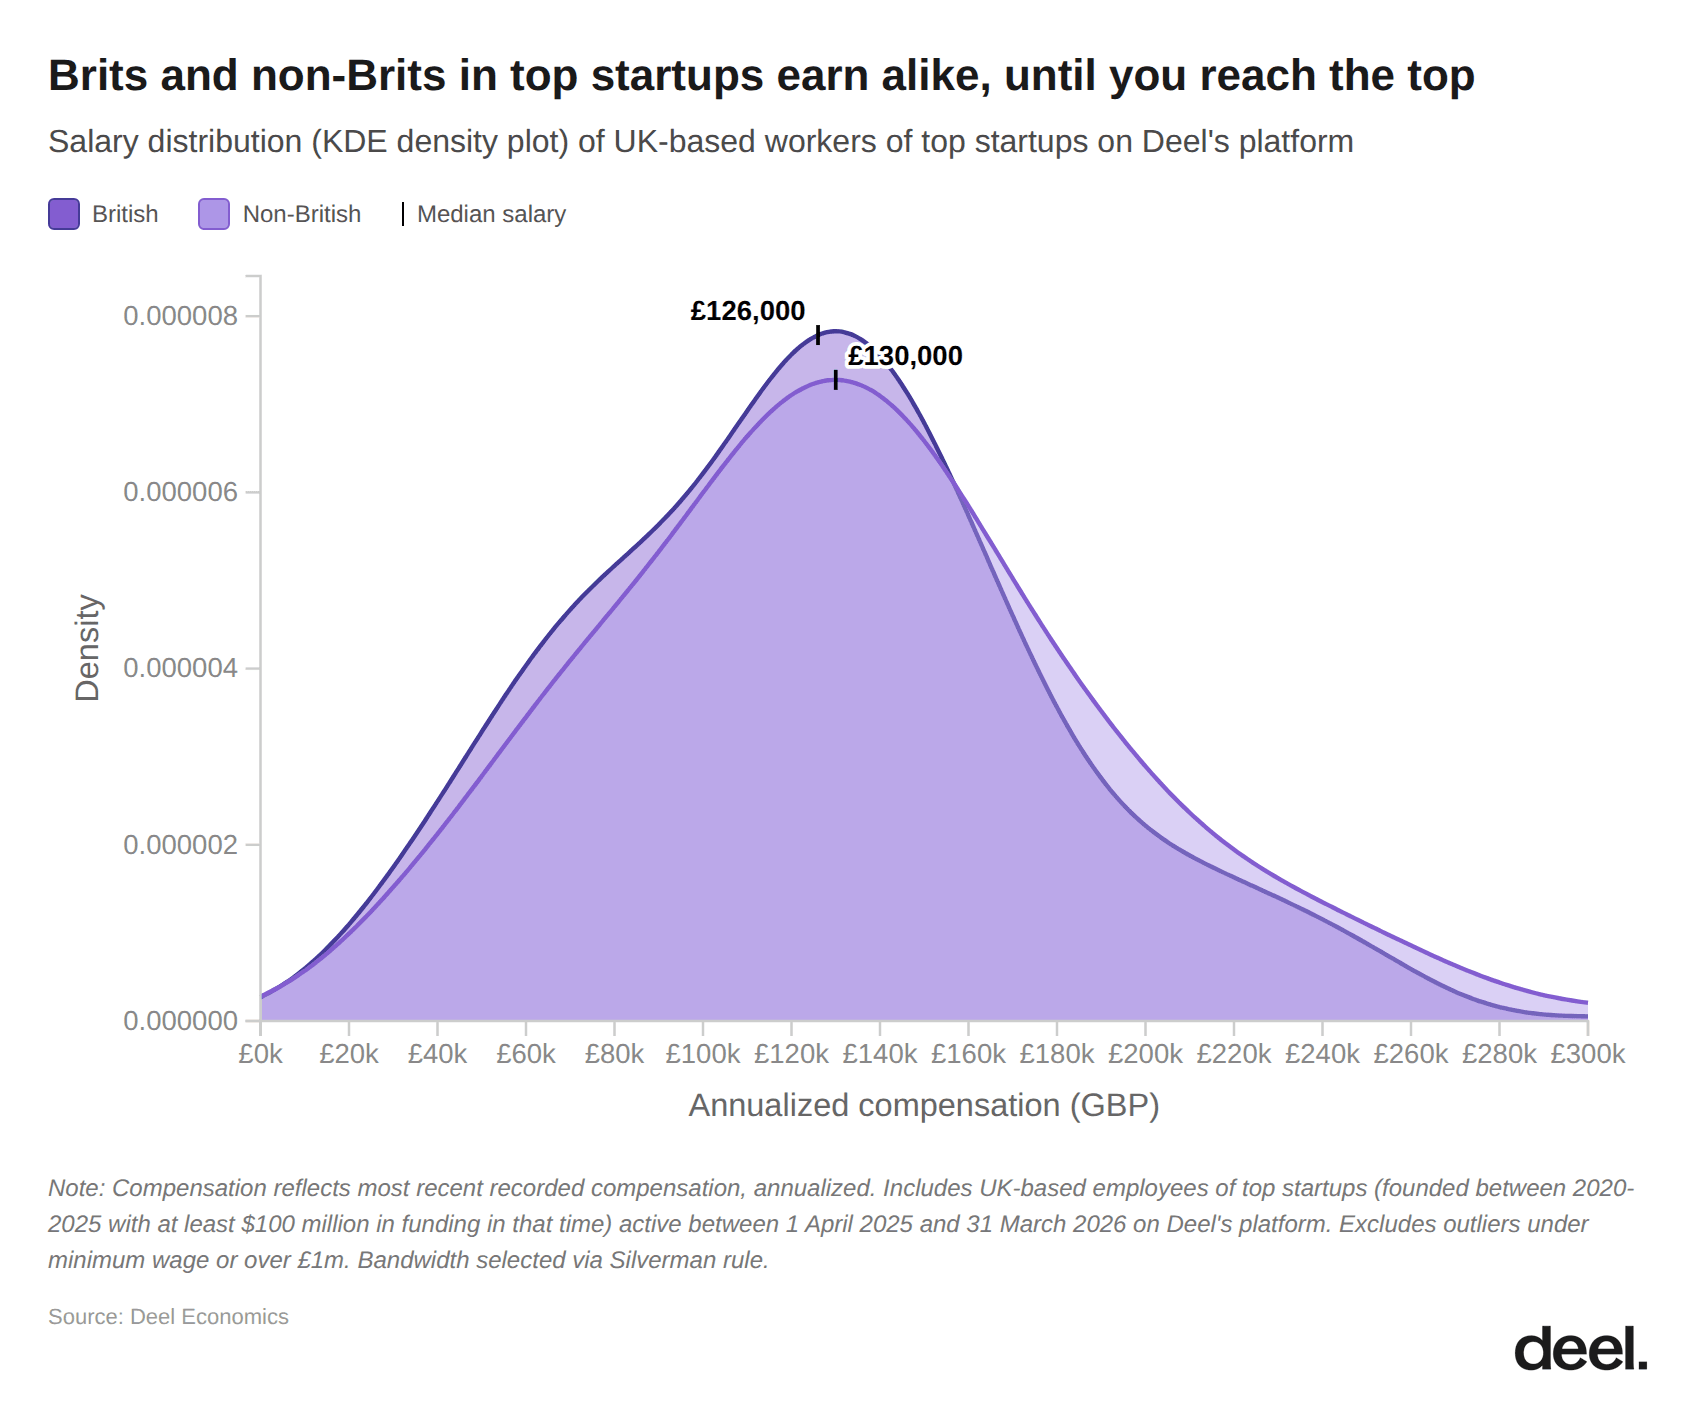
The two patterns reflect different visa systems and different talent supply structures. UK foreign hiring at startups spreads across many roles on relatively accessible visa routes. US foreign hiring concentrates almost entirely at the top of the pay distribution in hard-to-fill technical roles. Both are evidence that international hiring is about access to talent rather than cheap labor.
India dominates every major visa program
If there's a single country winning the global talent competition, it's India. Indian nationals are the largest source of:
- US H-1B visas (with China and France in second and third)
- UAE Golden Visas (reflecting India's 35% share of the UAE's total population)
- UAE Standard Employment Visas (India and UK lead)
And they rank second on:
- UK Skilled Worker visas (second only to the US)
- EU Blue Cards (second to Russia)
Across every major skilled visa program in our data, India is in the top two.
This dominance reflects the size and strength of India's technical graduate pipeline. Germany's Opportunity Card, which allows non-EU professionals to enter without a job offer and search for work, has issued 11,497 cards so far, a third of them to Indians.
Indian workers themselves are spreading across a widening map. The top destinations for Indian nationals working abroad on Deel's platform are the UAE, Singapore, the United Kingdom, the United States, and Canada. The fastest-growing destinations tell a slightly different story: Australia leads with 724% year-over-year growth in the Indian workforce on the platform, followed by the UK (142%), the US (139%), Ireland (131%), and the UAE (121%). Indian workers moving abroad skew toward early- and mid-career, with roughly equal shares in the 25–34 (33.0%) and 35–44 (34.1%) age brackets.
India's position as the largest source of internationally mobile workers is unchallenged. But where workers from other countries go reveals distinct patterns.
Americans abroad gravitate toward Europe. The top five destinations for American workers on work permits are the UK, Netherlands, Germany, Canada, and Spain – all European except Canada. Within the EU, Amsterdam tops the list of cities, followed by Berlin, Barcelona, Madrid, and Paris.
British workers abroad follow a different path: the UAE, Australia, and Canada top the list. Tax advantages, higher salaries, and lifestyle options pull mid-career British professionals toward these markets. When British workers do stay within Europe, Spain and Portugal dominate, driven by remote work arrangements rather than traditional office-based roles.
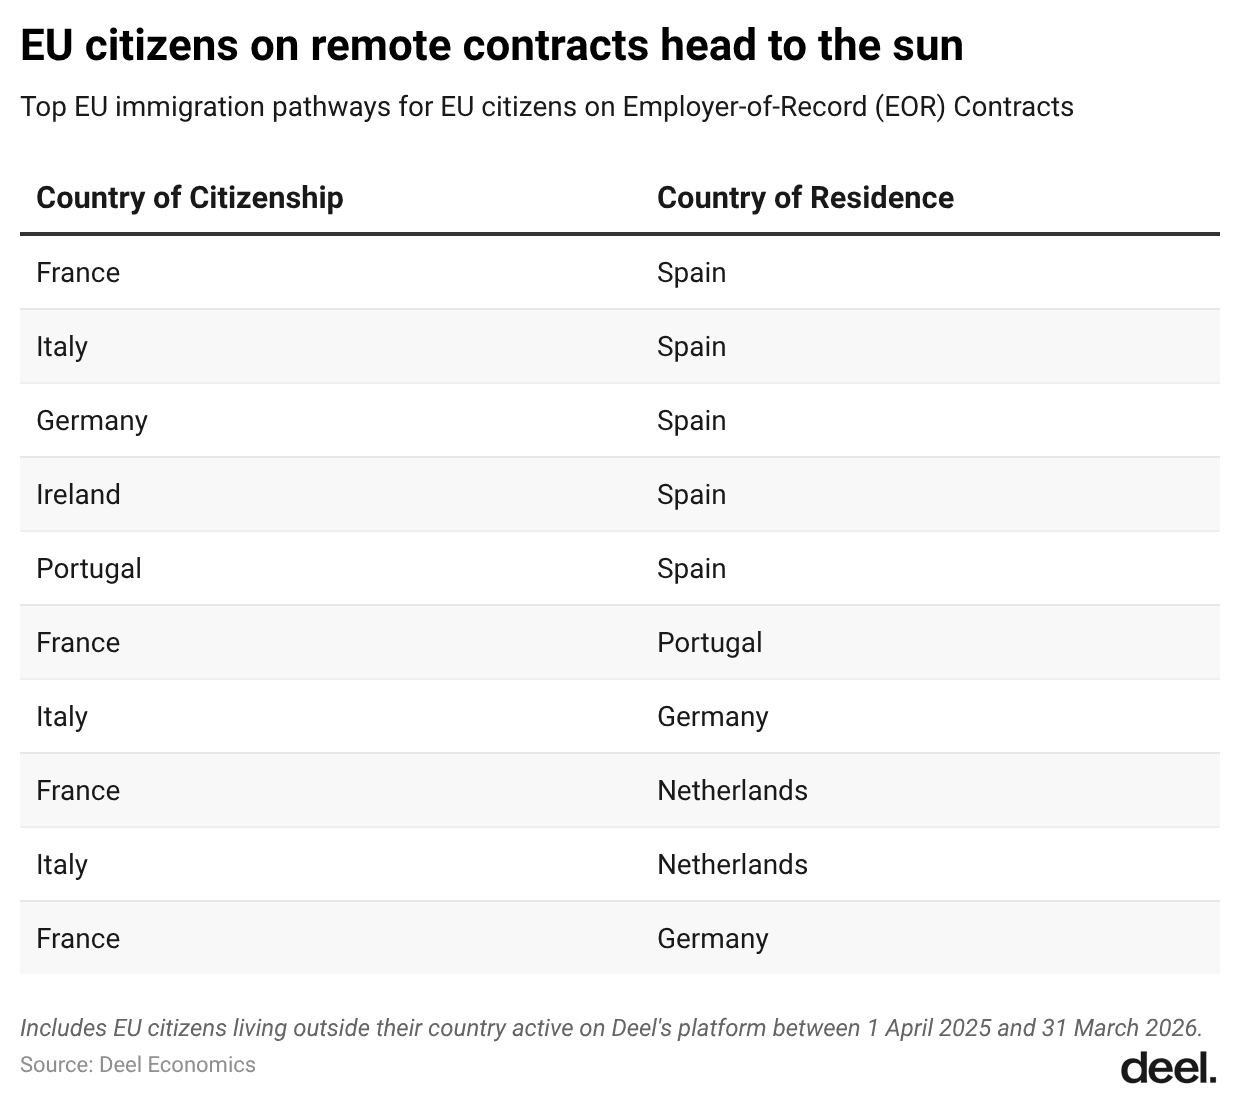
EU citizens working remotely show a clear preference for sunshine. The top six migration routes within Deel's EOR workforce (which are predominantly remote positions) all flow into Spain and Portugal: France → Spain, Italy → Spain, Germany → Spain, Ireland → Spain, Portugal → Spain, France → Portugal.
The France → Spain route alone now accounts for nearly 600 French nationals on Deel's platform, more than triple the number two years ago and up 71% in the past year. They concentrate in Barcelona (45.6%) and Madrid (21.7%), and 57.8% of them work in tech and information services. Spain's appeal isn't pay, with French EOR workers in Spain earning a median of €67,500 versus €82,000 for French EOR workers still in France. The real appeal is the combination of remote-work flexibility, lower cost of living, and proximity to home.
Asia-Pacific workers follow markedly different patterns from one country to the next. Australian nationals abroad gravitate toward English-speaking economies and the Middle East, and the top destinations are Singapore, the UK, the US, the UAE, and Germany. Australia, in turn, draws its foreign workers primarily from India (its top source of nationality), followed by New Zealand, the UK, China, and Sri Lanka. Singaporeans show a similar English-speaking-economy preference: their top destinations are Australia, the UK, the US, Hong Kong, and Thailand. But Singapore's inbound mix is overwhelmingly regional, drawing from India, Malaysia, China, the Philippines, and the UK.
APAC age patterns vary too. Australian immigrants on Deel match the global age distribution (45% are 25-34, in line with the 43% global average). Singapore stands out as a destination for established professionals, with the largest share of immigrants in the 35-44 (41.3%) and 45-54 (25.7%) brackets, reflecting its role as a mid-career hub rather than an entry-level one.
Where foreign workers cluster
Geography matters, and foreign workers don't distribute evenly. Typically, they concentrate in specific cities and, within those cities, specific neighborhoods.
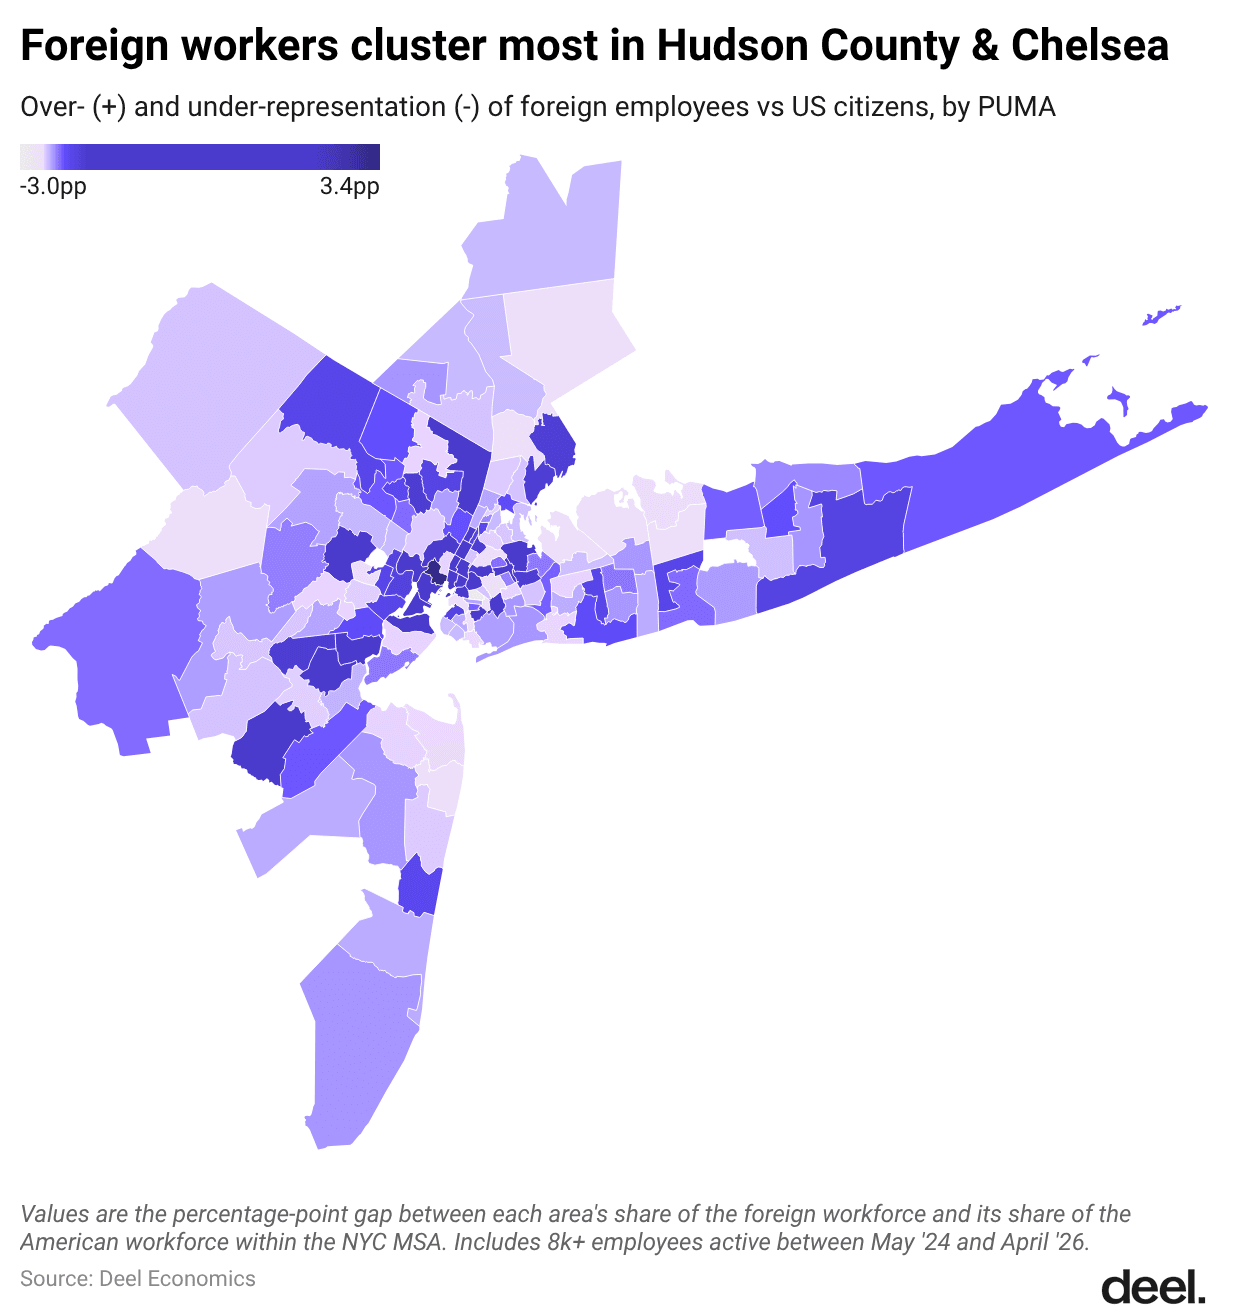
United States
New York City leads as the top destination for foreign workers on Deel's platform, followed by San Francisco and Los Angeles. Within NYC, foreign workers are overrepresented in neighborhoods like Jersey City, Chelsea, and Williamsburg relative to their overall share of the workforce. American workers, meanwhile, are more present in central Brooklyn and Queens neighborhoods like Bed-Stuy, Ocean Hill, and Flatbush.
This geographic sorting persists even among workers aged 20-29, ruling out age as the primary driver. Foreign employees display distinct neighborhood preferences independent of their younger average age.
United Kingdom
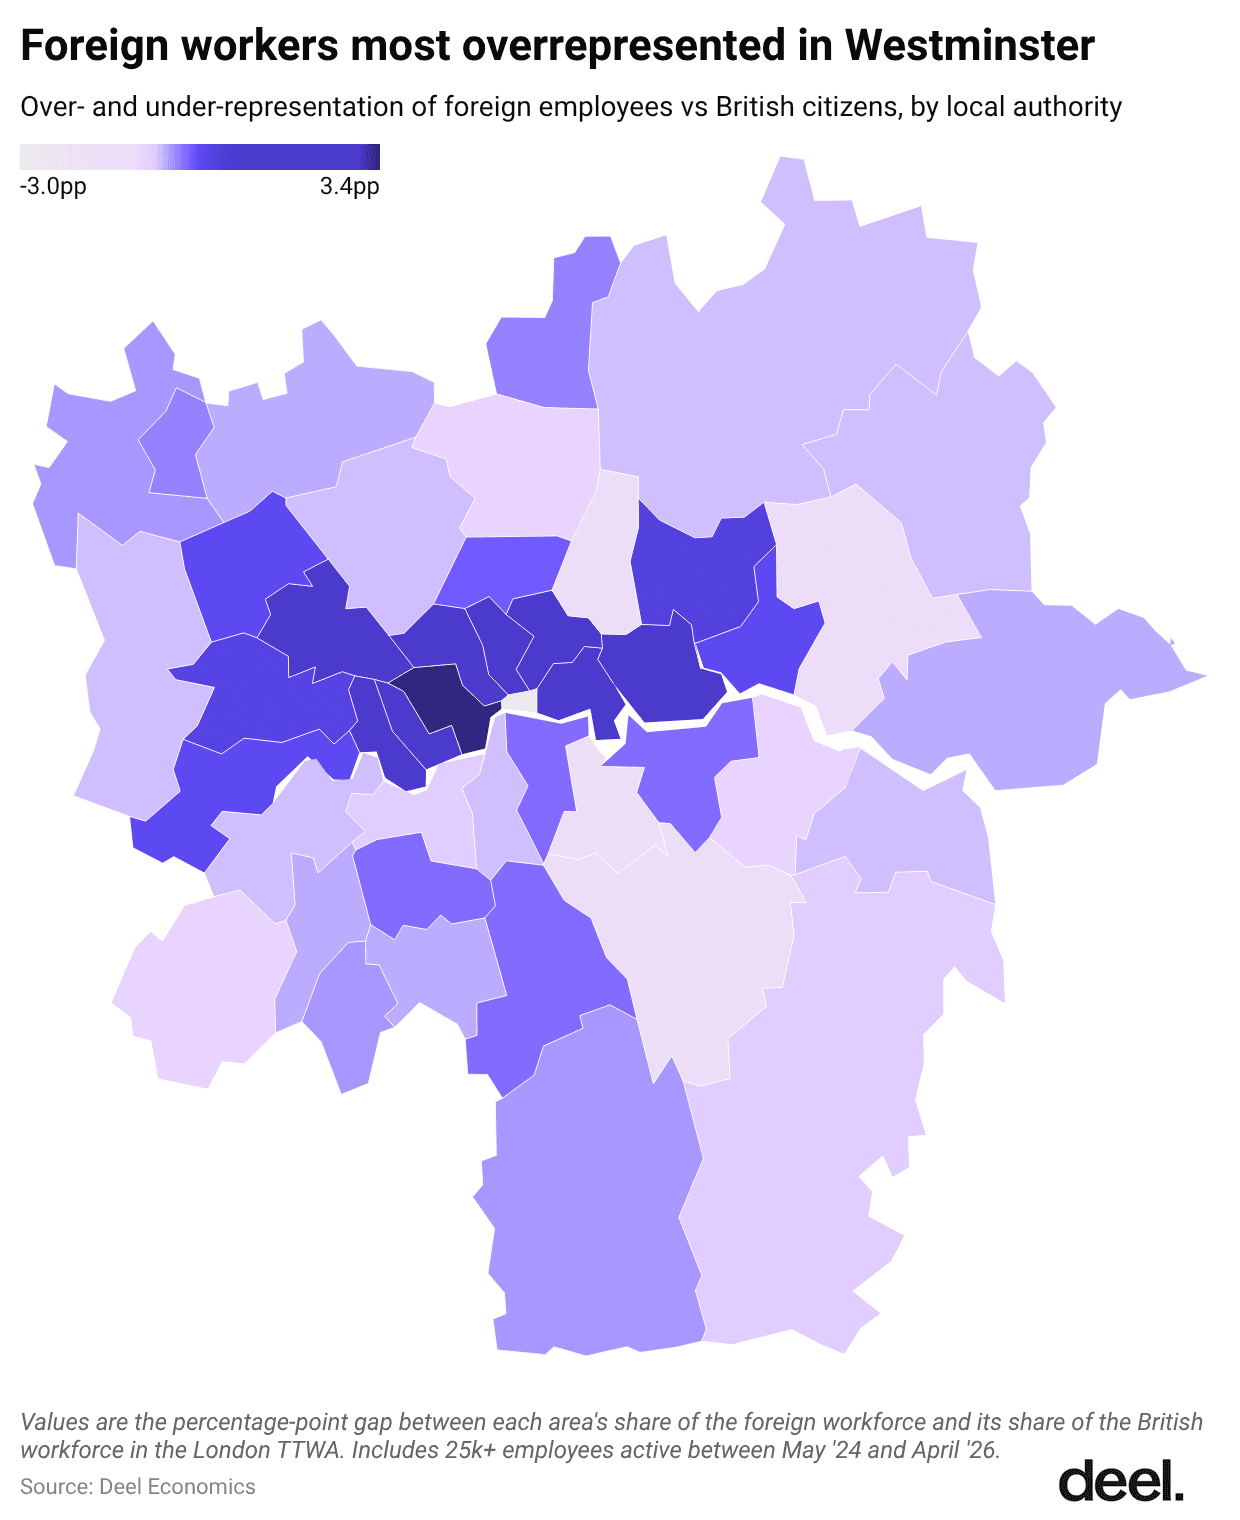
Foreign workers on Deel cluster near London and a handful of university towns. Cambridge, Oxford, and Edinburgh top the list alongside Manchester, Birmingham, and Reading. Comparing each area's share of the foreign workforce with its share of the British workforce reveals notable overrepresentation in London, Slough (proximity to Heathrow Airport), Cambridge, Edinburgh, and Oxford.
Within the London commuting zone, foreign workers concentrate in two distinct types of borough: the wealthy inner west (Westminster, Kensington, Islington, Camden) and the East End (Tower Hamlets, Newham). When restricting the analysis to workers aged 20-29, the pattern shifts eastward. Newham, Tower Hamlets, and Hackney emerge as the boroughs where young foreign workers are most overrepresented relative to their British counterparts. Americans live up to their stereotype: they're most overrepresented in Kensington and Chelsea, where Notting Hill sits.
European Union
Berlin leads for EU Blue Card holders, followed by Munich, Paris, Frankfurt, and Luxembourg City. German cities' dominance is unsurprising as Germany issues 72% of all EU Blue Cards (56,252 of 78,096 total in 2024).
The EU Blue Card is a high-skilled work permit valid across 25 of 27 EU member states (excluding Denmark and Ireland). But in practice, it's heavily concentrated in Germany, which uses it as its main instrument for skilled labor migration. The top five nationalities are Russia, India, the US, Israel, and the UK. Russia's prominence reflects geographic proximity to EU markets and the geopolitical and economic disruption pushing its citizens to seek opportunities abroad. The others are nationals with strong domestic labor markets, suggesting they target Europe for lifestyle, proximity, or company-specific reasons.
How foreign workers move differently
Our data reveals another pattern, where foreign workers move more often but cover less ground.
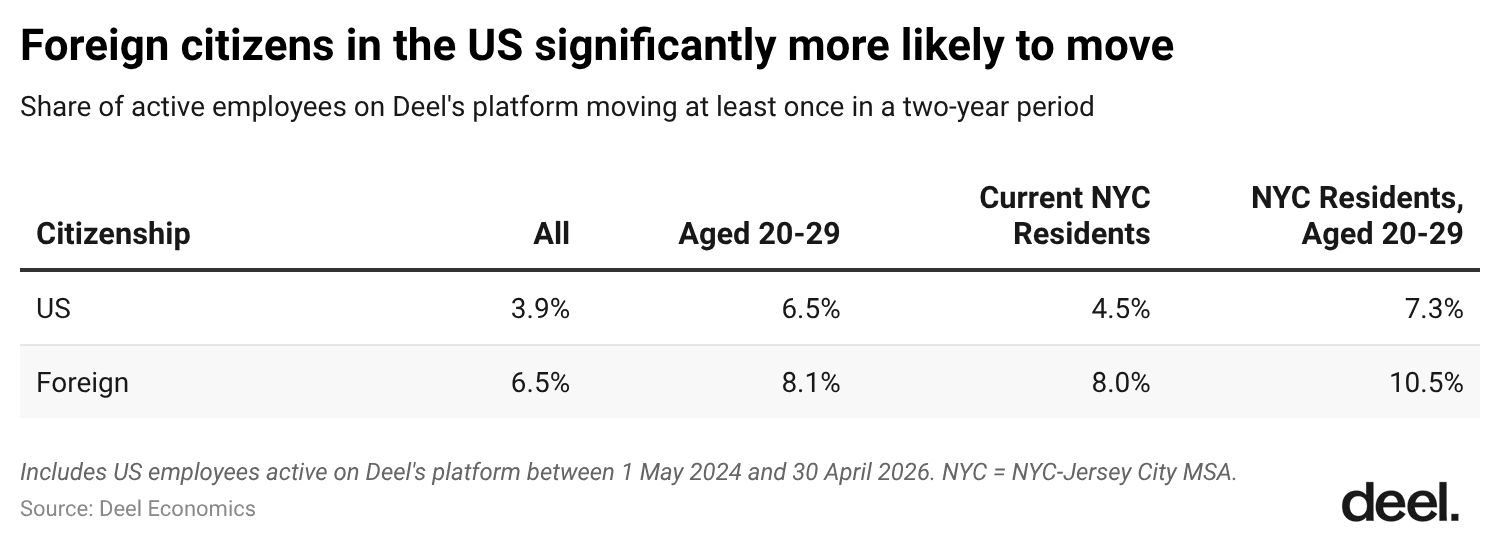
They move twice as often
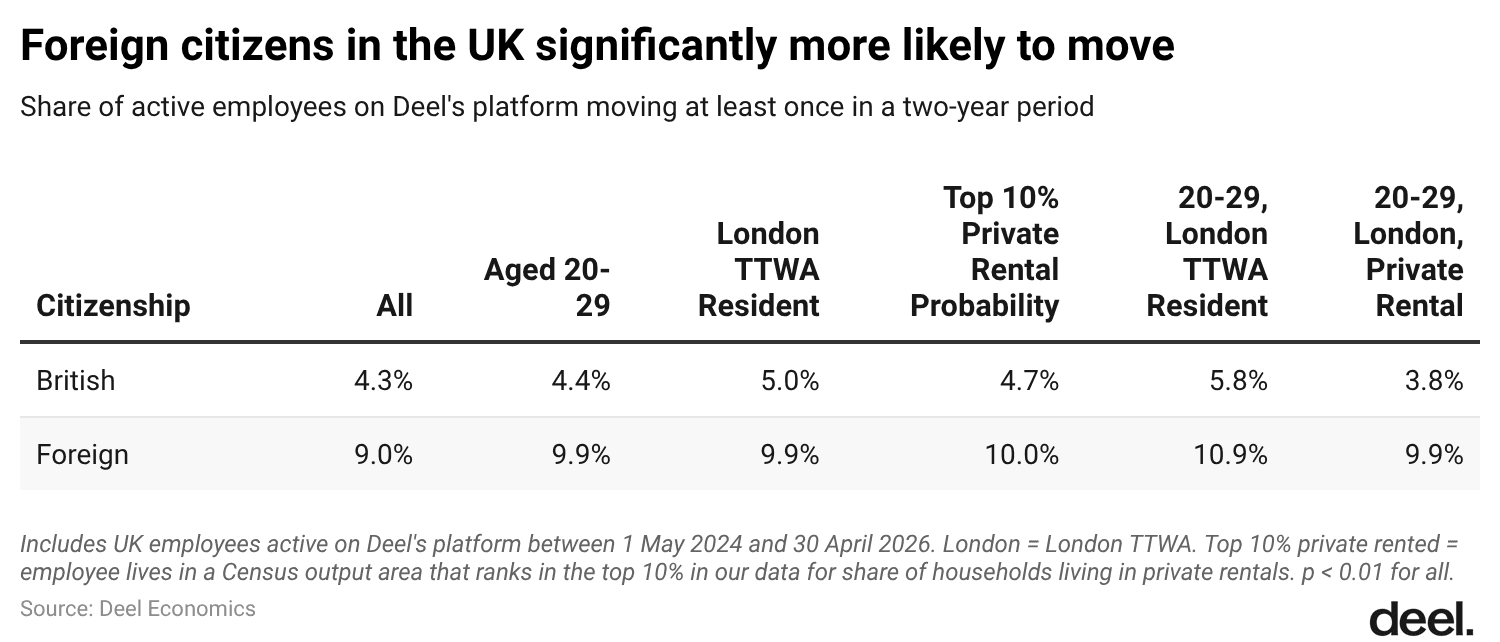
Foreign workers are over twice as likely to have moved within the past two years compared to local workers. In the US, 6.5% of foreign workers moved versus 3.9% of Americans. In the UK, the gap is even wider.
This pattern holds within age groups, across cities, and after controlling for housing tenure (private rental versus ownership). A logistic regression confirms that citizenship is a strong predictor of staying put. Foreign workers are roughly twice as likely to have moved as local workers, even after accounting for age, whether they live in London or major US metros, and local housing market conditions.
The implication is that a workforce with a larger share of foreign employees will also be one that moves more frequently.
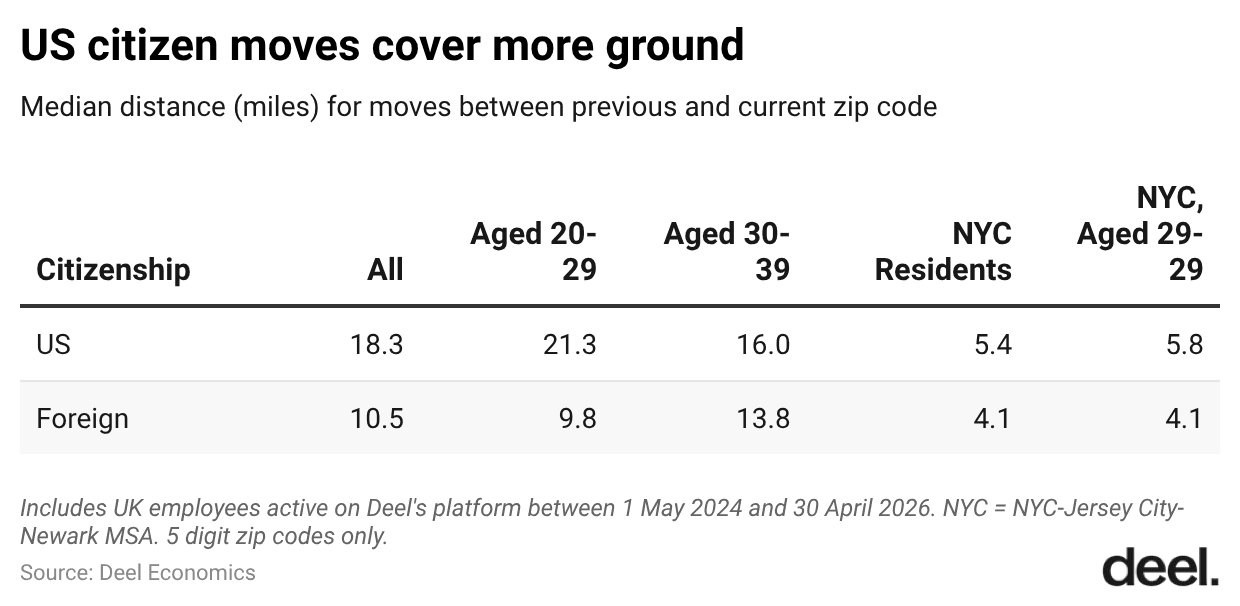
But they move shorter distances
Despite their higher likelihood of moving, foreign workers move shorter distances. The median move for a foreign worker in the US covers 10.5 miles, compared to 18.3 miles for an American worker. In the UK, foreign citizens move a median of 5.0 kilometers, compared to 9.2 kilometers for British workers.
This pattern holds across every subgroup analyzed: workers aged 20-29, workers aged 30-39, current London residents, and London residents aged 20-29. Even when both groups move within London, British employees move significantly longer distances – 5.9 kilometers compared to 4.4 kilometers for non-British employees.
Why is that the case? Foreign workers likely have weaker local roots, including fewer extended family ties, less attachment to specific neighborhoods, and more flexibility to relocate for work. But when they do move, they stay within familiar areas: the same city, the same commuting zone, the same support networks.
The age question: Is the UK losing its youth?
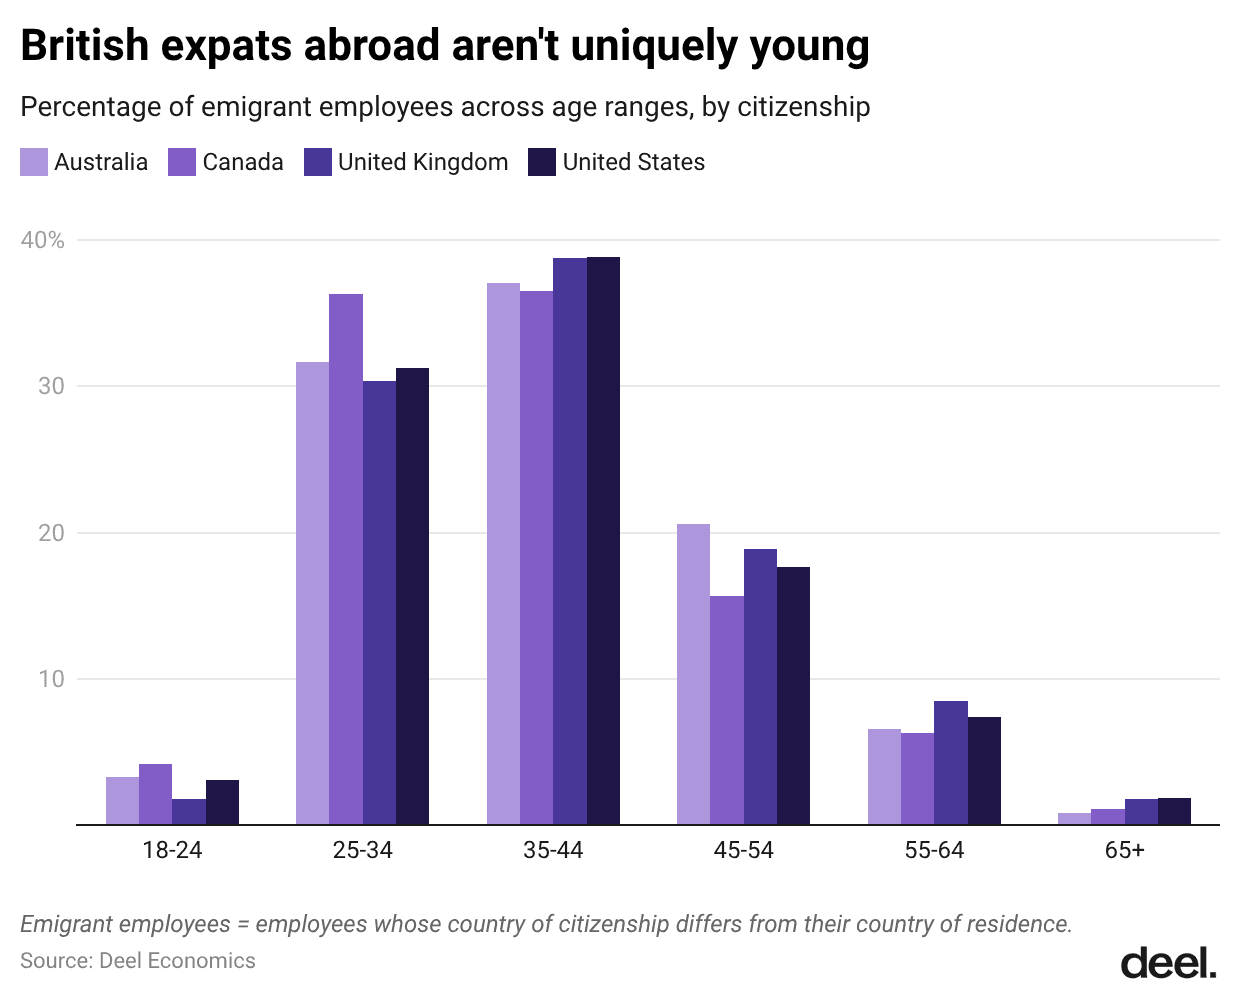
Headlines in late 2025 suggested the UK was experiencing a "youth exodus" after ONS data showed younger people were most likely to leave the country. But this framing misses a critical point: immigrants everywhere tend to be young.
Globally, 43% of workers on Deel's platform who live in a country different from their citizenship are aged 25-34. When workers from high-income countries emigrate, they skew slightly older: 39.4% of British workers abroad are aged 35-44, nearly identical to Americans (39.3%), Canadians (39.2%), and Australians (36.2%).
The UK isn't experiencing a unique youth exodus so much as it’s experiencing the same pattern seen across comparable economies. Young workers are going to move; the question is whether they move to the UK or away from it.
The most common age at which UK citizens are approved for a new work visa is between 25-34, just like Canada, India, and the US. This is the standard age profile for internationally mobile workers, not evidence of a UK-specific crisis.
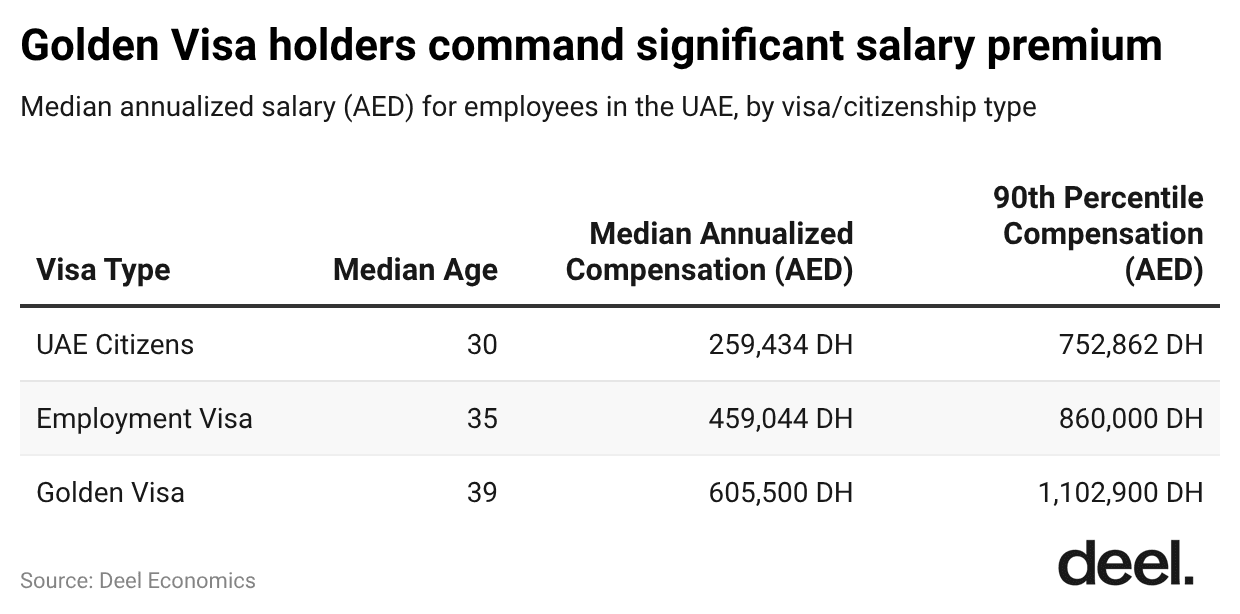
The Middle East: The Golden Visa divide
The UAE's Golden Visa program is designed for high earners, and the salary data confirms it. Golden Visa holders on Deel's platform earn a median of 605,000 AED (approximately $164,000), compared to 459,000 AED ($125,000) for standard employment visa holders and 259,000 AED ($71,000) for UAE citizens. The 90th percentile gap is even wider, with Golden Visa holders earning over 1.1 million AED ($300,000).
India dominates both visa categories. British nationals rank second for Golden Visas, skewing heavily toward high-net-worth professionals. Notably absent from standard employment data are Pakistan and Bangladesh – two of the UAE's largest nationality groups – suggesting those populations concentrate in lower-skill visa categories such as domestic work, construction, and logistics rather than professional tracks.
What this means
The talent map is being redrawn. Workers with in-demand skills have more options than at any point in recent history, and they're concentrating in markets that offer both economic opportunity and clear pathways. Companies competing for this talent are competing on quality rather than cost.
The salary premium for visa holders reflects the fact that visa processes filter for skills in short supply. The workers who clear the bar earn more because local markets can't fill the roles they occupy. Our data shows where talent is concentrating. The question for governments and companies is whether they're building systems that attract it or send it elsewhere. Processing times tell that story directly. Canada and the UK have moved to digital-first systems that resolve in weeks; markets that remain paper-based can take months. In competitive hiring, that gap often decides where a worker ends up.
Methodology
(full methodology available upon request)
This analysis draws on data from Deel's platform, which covers over 40,000 companies hiring across 150+ countries. The primary observation window is April 1, 2025 to March 31, 2026. UK workforce trends use monthly data from January 2022 forward. Mobility analyses track address changes over a two-year window (May 1, 2024 to April 30, 2026).
An employee is considered active if their contract is being managed or they are being paid through Deel at least once in a given month. Foreign citizenship is determined when an employee's citizenship differs from their country of residence or contract. Visa status was taken from Deel’s platform.
Salary comparisons are based on annualized base salaries and are restricted to employees working for the same company and same Deel product to ensure fair comparisons. Occupations were matched to standardized classifications using the European Commission’s ESCO occupation framework via a two-stage AI model that analyzes job titles, descriptions, and industry data.
Geographic patterns are based on employees' postal codes, matched to travel-to-work areas (UK) and metropolitan statistical areas (US) using government-produced correspondence tables. "Overrepresented" refers to neighborhoods where foreign workers' share of the local workforce exceeds their share of the city's native workforce. Moving distances were calculated using the Haversine formula based on postal code centroids.
We fit a logistic regression on UK data predicting employee mobility using salary (GBP), London residency, British citizenship, and neighborhood private rental prevalence (2021 Census via Nomis). All variables were significant (p < 0.01) except rental prevalence (p = 0.10). British citizens were ~50% as likely to move as foreign nationals.
UK foreign-born workforce estimates were calculated using multilevel regression and post-stratification: ridge-penalized logistic regressions on Deel employee records aggregated by month, ONS industry section, and 2-digit SOC code, reweighted using UK population data from the ONS and calibrated to HMRC data reported by Oxford's Migration Observatory through December 2024. Estimates beyond December 2024 extrapolate the calibration ratio forward with slow decay to account for compositional drift in Deel's UK customer base.
All analyses exclude independent contractors. Workers and organizations were assigned anonymized IDs before analysis, and access was limited to a need-to-know basis.
Read the full report here.
Lauren Thomas is Deel's founding Economist, where she’s helping to bring Deel’s mission of breaking down geographic barriers to opportunity to life through data — a mission that resonates personally, as she's worked and studied in six cities across three countries!
Before joining Deel, Lauren worked in economic research and data storytelling at the Federal Reserve Bank of New York, Glassdoor, and Stripe. She has degrees in economics and data science from Oxford, Université Lumière Lyon 2, and Northwestern University.
Outside of work, she enjoys reading, playing volleyball, climbing, sewing her own clothes, and using Oxford commas. She does not enjoy long flights but takes a lot of them anyway!