Article
6 min read
Labo(u)r market roundup: May 2026

Author
Lauren Thomas
Published
May 26, 2026


The low-hire market continues on both sides of the pond, though the UK is in slightly worse shape. UK unemployment is up half a percentage point on the year (now 5.0%), and job vacancies have fallen for two months running. In the U.S., unemployment has held steady at 4.3%, and job openings are broadly unchanged. Both countries are stuck in a low-hire pattern, but the UK is starting to see it tip into rising joblessness.
The two part ways on government employment: the UK keeps adding public sector jobs while US federal employment continues to fall. The big common thread is health and social care, which is doing most of the work on employment growth in both places, thanks to an ageing population on both sides of the Atlantic pushing up structural demand for these services.
U.S.
Job openings stay stagnant while hires edge up in March
The BLS JOLTS and the Employment Situation, released earlier this month, once again showed little change from the previous month. Job openings continue to stay stagnant at 6.9 million in March. In a bright spot, hires edged up to 5.6 million (up 655k from last month) and 3.5 percent, driven by an increase in transportation, warehousing and utilities; professional and business services; and accommodation and food services.
Whether accommodation and food services keep growing will be worth watching this summer, as the World Cup brings demand to North America while higher jet fuel prices push in the opposite direction.
In March, quits held at 3.2 million and layoffs at 1.9 million, with little change from the prior month. The year-on-year shift is more revealing: quits are down by 285,000 while layoffs are up 272,000, consistent with a cooling labour market where people aren’t quitting for new jobs but they are being let go. This is consistent with Deel’s data, which indicates that job hopping has fallen significantly - especially for the youngest employees on the platform - over the past two years.
One sector has seen especially significant rises in layoffs in the BLS data (and, similarly, drops in Deel’s job hopping data): information & technology, which hovered around 40,000 per month in late 2025 and is now up past 60,000. This might not be a surprise, given all the layoff news out of Silicon Valley, but it’s certainly worth keeping an eye on.
Total U.S. employment has risen while unemployment remains mostly steady, with some increases in short-term unemployment
Total U.S. employment in April rose by 115,000, and unemployment has stayed steady at 4.3%, little change from last year. While long-term unemployment has stayed steady, the number of short-term unemployed increased by 358,000 to 2.5 million in April – another indicator that layoffs in early 2026 have picked up and are starting to feed through into unemployment duration details.
Health care, social assistance, transportation, and retail drove employment increases in April, while federal government employment has continued to decline. Health care's growth in particular reflects long-running structural demand from an ageing population rather than cyclical recovery, and is reflected in employment numbers across the pond.
U.K.
Job vacancies fall for the second month in a row
The U.K. ONS released its monthly labour market overview earlier this week. Vacancies have dropped for the second month in a row. A few months ago, I wrote that the flatness of vacancies was a potential sign of hope for the U.K. job market; while two months of dropping still doesn’t make a trend, the fact that job vacancies are falling is not a good sign. Job vacancies are a leading indicator - they’ll need to increase before we can move out of the low-hire, low-fire paradigm that is currently dominating.
Unemployment has fallen from last quarter, but is up on the year
As in last month’s labour market release, overall unemployment is down from last quarter, at 5.0%, but up since last year’s rate of 4.5%. With that said, this improvement masks a concerning signal: HMRC payroll data shows payrolled employee numbers have continued to fall, and unemployment remains elevated from last year. I would be surprised if unemployment greatly improved from its current position, especially with the new Employment Rights Act rolling out throughout the rest of 2026 and into 2027 - it’s likely to reduce labour market dynamism and constrain employer flexibility (which won’t be good for employment).
Wages increase at historically high rates, but only if you don’t consider inflation
Although growth in employees’ average earnings, at 3.4% for regular earnings and 4.1% for total earnings (which includes bonuses), is markedly higher than its pre-pandemic norm, persistently high inflation means that real wage growth (0.1% for regular earnings and 0.8% for total earnings) remains substantially weaker than in the 2010s.
This divergence probably explains why workers’ sentiment about the labour market remains fairly negative, even though their nominal earnings have gone up significantly. The gap between nominal wage gains and actual real wage growth underscores the substantial squeeze on household purchasing power.
U.K. labour market deep dives
Female employment grows while male employment falls
The latest labour market statistics show that female employment has increased by ~0.2 percentage points (from 72.0% to 72.2%), whereas male employment has declined by ~0.2 percentage points (from 78.1% to 77.9%). While the difference here is small, it underscores a highly relevant point: the variance in employment seems to be entirely driven by industry mix.
Female-dominated industries (human health & social work, education, and public admin) are growing, whereas many male-dominated ones (construction, transport, mining, manufacturing, etc.) are contracting. Women within male-dominated industries aren’t doing any better than men in those groups.
I expect to see this difference continue as human health & social work employment and education continue to grow in response to an ageing population and/or increased labour productivity in other sectors.
There’s a parallel story in economic inactivity. Interestingly, this measure has also dropped for both groups - by 1.1% for women and 1.7% for men. But the reasons why inactivity has dropped vary by gender: most women are returning to the workforce (or staying in it) rather than staying at home to look after their family. This is a trend that we’ve seen for the past several years – possibly as a result of high inflation beginning in 2022. For men, the drop in inactivity is mostly driven by a fall in long- and short-term illnesses (we see the opposite for women).
Self-employment continues to fall
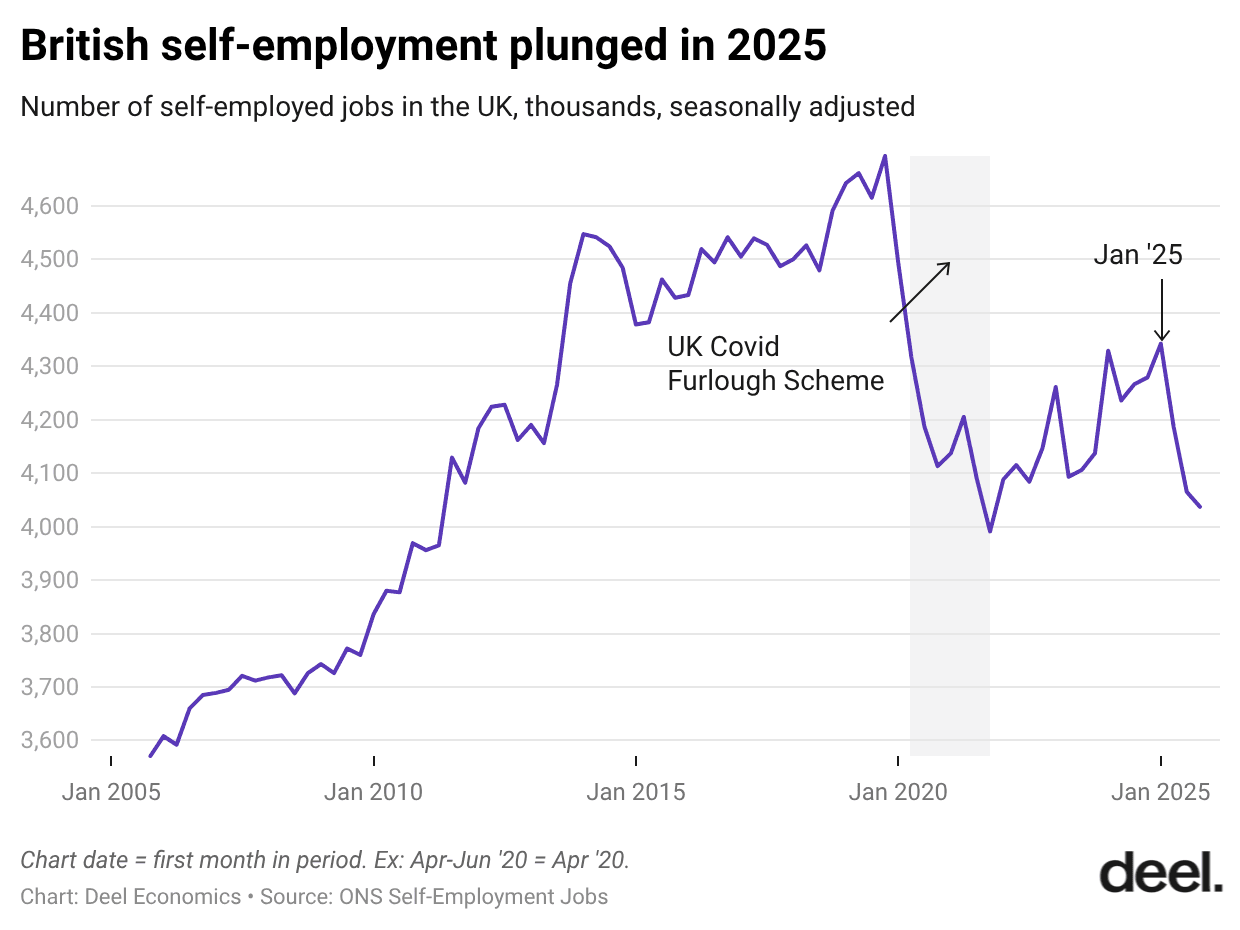
Post-pandemic, U.S. and U.K. self-employment went in opposite directions — one of the most striking points of divergence between the two labour markets. The U.S.’s self-employment rate surged during the pandemic, with a rise in new business formation buoyed by newly unemployed workers with generous unemployment aid and up to $5k in stimulus checks. The U.S.’s main small business support program, the Paycheck Protection Program, was also structured as a forgivable grant program rather than a loan.
The U.K. instead relied on a 19-month furlough program that paid employees 80% of their wages so they could stay on payroll rather than be made redundant, narrowing the flow of displaced workers into new business formation. Pandemic-era self-employment took a dive, and although it seemed to be slowly recovering after the furlough scheme ended, ONS data seems to point to self-employment abruptly falling throughout all of 2025.
Why might this be? I see three likely drivers:
- A much steeper rise in overall unemployment in 2025.
- The rise in employer NICs in late 2024, potentially impacting self-employment.
- Industry mix. Many of the industries that are growing - education, healthcare, and public admin - are ones with relatively lower levels of self-employment. People are more likely to be self-employed in industries that are contracting, like construction.
Either way, I wouldn’t expect any of these drivers to turn around anytime soon.
Data deep dive
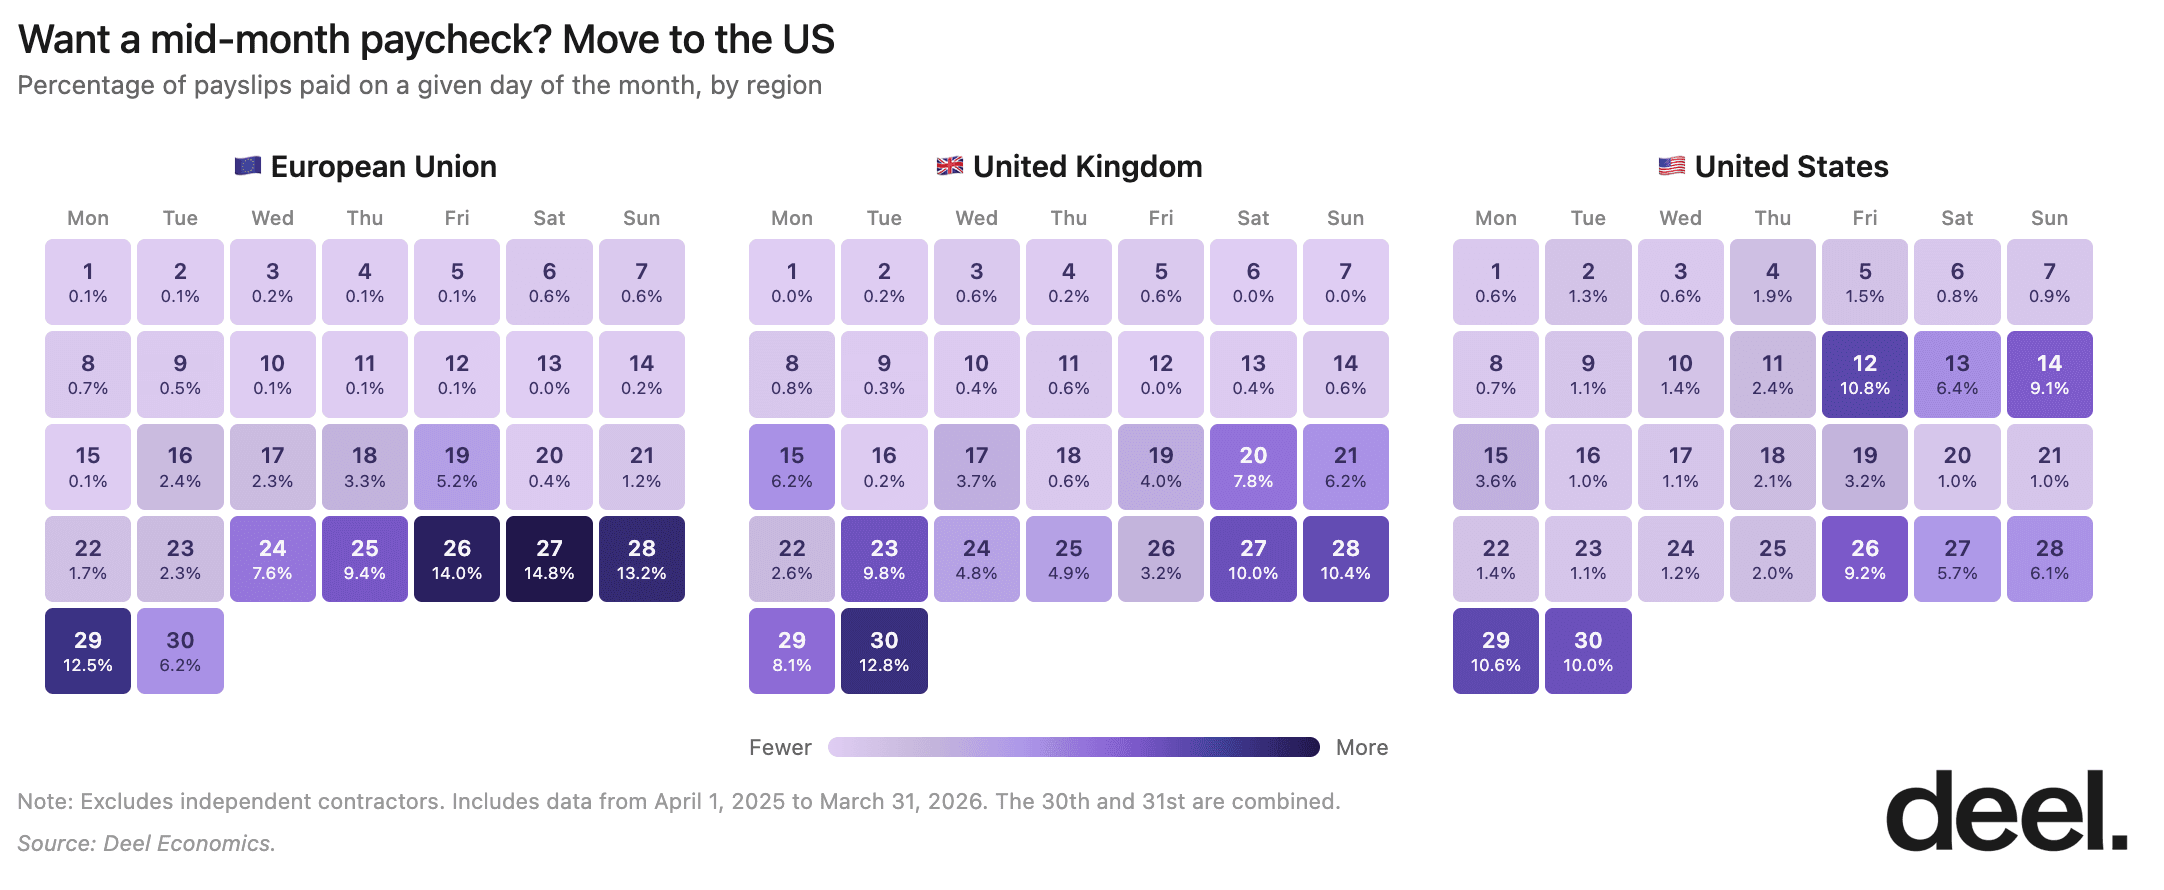
This month's data deep dive looks at the geography of payday. The last day of the month is pay day for me, and a whopping 12.8% of the employees on Deel’s platform in the U.K. You might not know that twice-a-month paydays are the standard in the US and monthly in Europe, but I immediately noticed this difference when I started my first job in the UK nearly five years ago.
I wondered about the timing of payments on our platform, so I looked at the percentage of payslips paid on each day of the month over the last year. You can clearly see the influence of fortnightly pay-cycles in the US versus monthly in the EU & UK. But the EU's payslips are more concentrated around the last few days of the month, while the UK sees spikes on the 15th, 20th, and 23rd as well as in the last few days.
These regional differences in financial habits aren't just limited to full-time employees. Contractors on Deel have an option to withdraw a portion of their paycheck in advance.
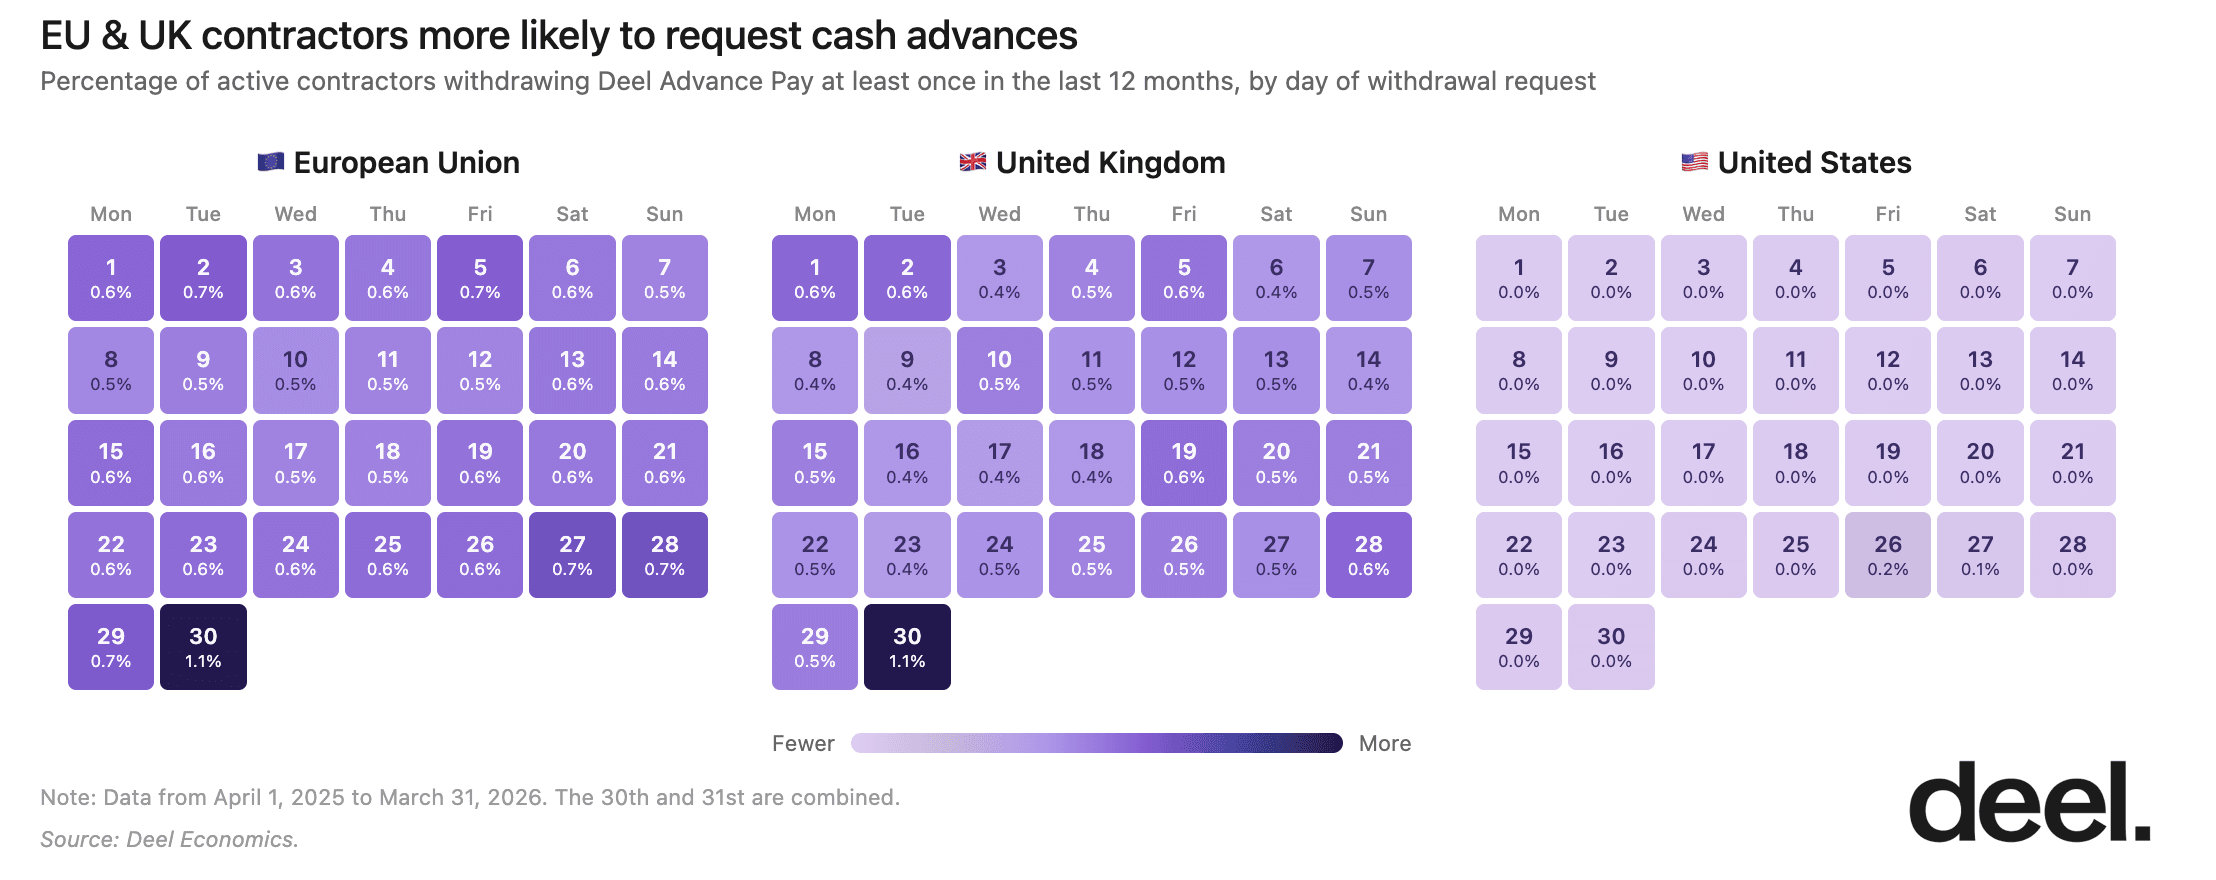
I looked at the percentage of active contractors who had withdrawn Deel Advance pay at least once in the last 12 months, by day of withdrawal. US contractors are less likely than their European counterparts to request a withdrawal - a pattern that held true even when I only looked at contractors paid more than $50 USD an hour.
This graph alone doesn't tell us why - perhaps US contractors have better access to and higher willingness to use credit, perhaps they're paid more often, or perhaps they're more likely to be longer-term rather than occasional project-based contractors.
What the data does tell us is that building a truly global team means understanding that financial norms are sticky: they don’t cross borders nearly as easily as modern-day hiring does.
Lauren Thomas is Deel's founding Economist, where she’s helping to bring Deel’s mission of breaking down geographic barriers to opportunity to life through data — a mission that resonates personally, as she's worked and studied in six cities across three countries!
Before joining Deel, Lauren worked in economic research and data storytelling at the Federal Reserve Bank of New York, Glassdoor, and Stripe. She has degrees in economics and data science from Oxford, Université Lumière Lyon 2, and Northwestern University.
Outside of work, she enjoys reading, playing volleyball, climbing, sewing her own clothes, and using Oxford commas. She does not enjoy long flights but takes a lot of them anyway!