Article
11 min read
Labo(u)r market roundup: October 2026

Author
Lauren Thomas
Published
October 23, 2026


Happy Friday! The ONS released the UK’s latest labour market update on Tuesday and the BLS the American equivalents earlier this month: here’s what stood out.
The labor market is stable, but fragile, and the weakness is concentrated. US hiring is flat, unemployment has stopped rising but isn’t falling, and most of the job growth is coming from one sector. In the UK, unemployment has dropped to 4.7%, but payrolls are down on the year and vacancies are below 700,000.
With that said, labour markets rarely move much month to month (March 2020 was very much the exception). It’s better to step back and take in the long view. Slack is shrinking in both countries, but dynamism has yet to return. Fewer people are out of work or underemployed, but that isn’t because hiring has picked up: US hires and quits have stayed low, while UK vacancies continue to fall.
US
Groundhog Day, JOLTs edition
Hires, job openings, and quits rates are unchanged in August
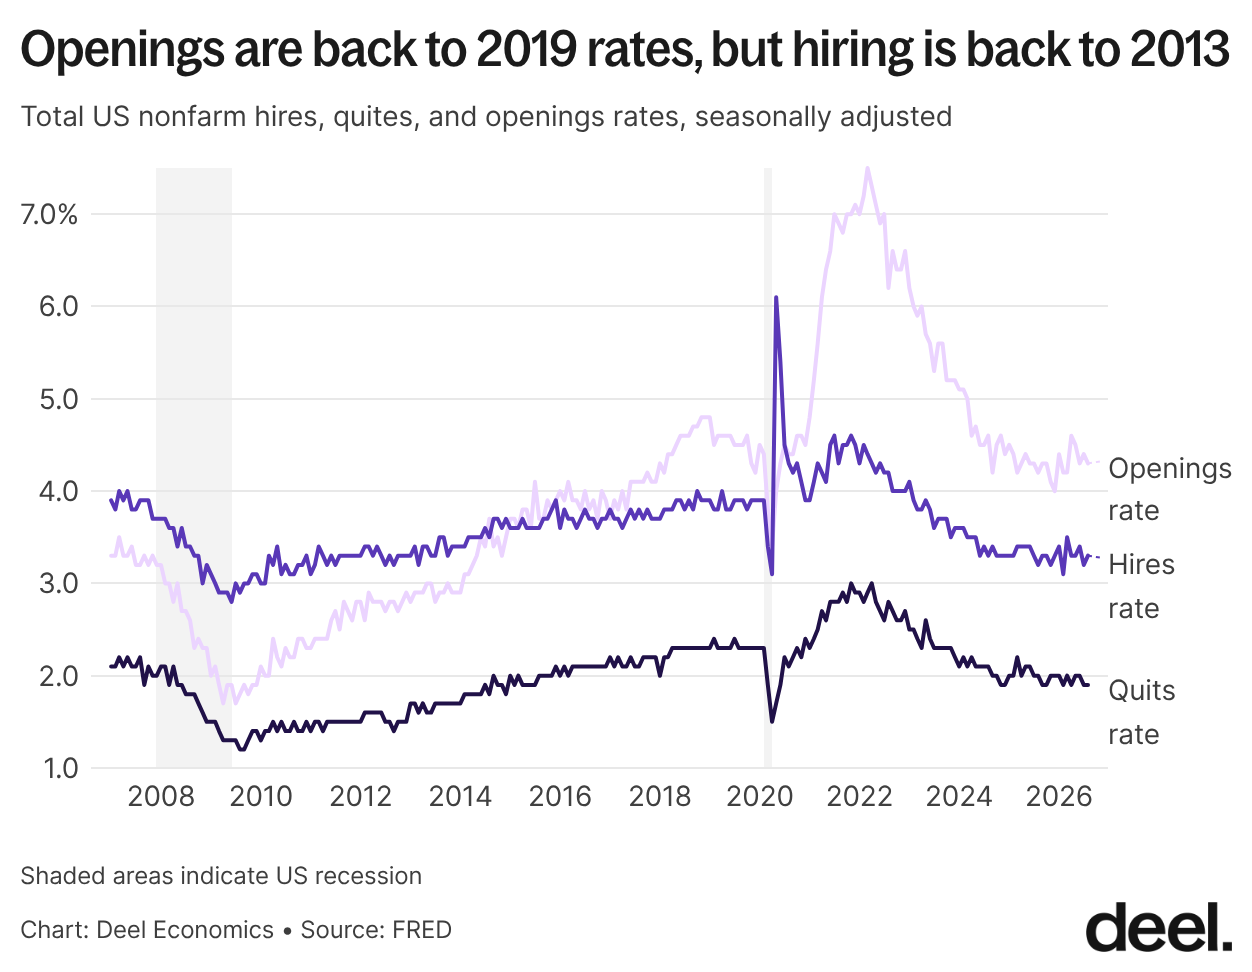
August’s hires rate came in at 3.3%, openings at 4.3%, and quits at 1.9% – all unchanged from last month’s JOLTs report. What I find most interesting here is the disparity between openings and hires: openings have fallen back to their 2019 rate, when the labor market was pretty strong, but hiring hasn’t been this weak since 2013, when the country was recovering from the Great Financial Crisis (GFC).
The chart below confirms this change: the number of job openings per hire has actually settled at a level higher than it was prior to the pandemic!
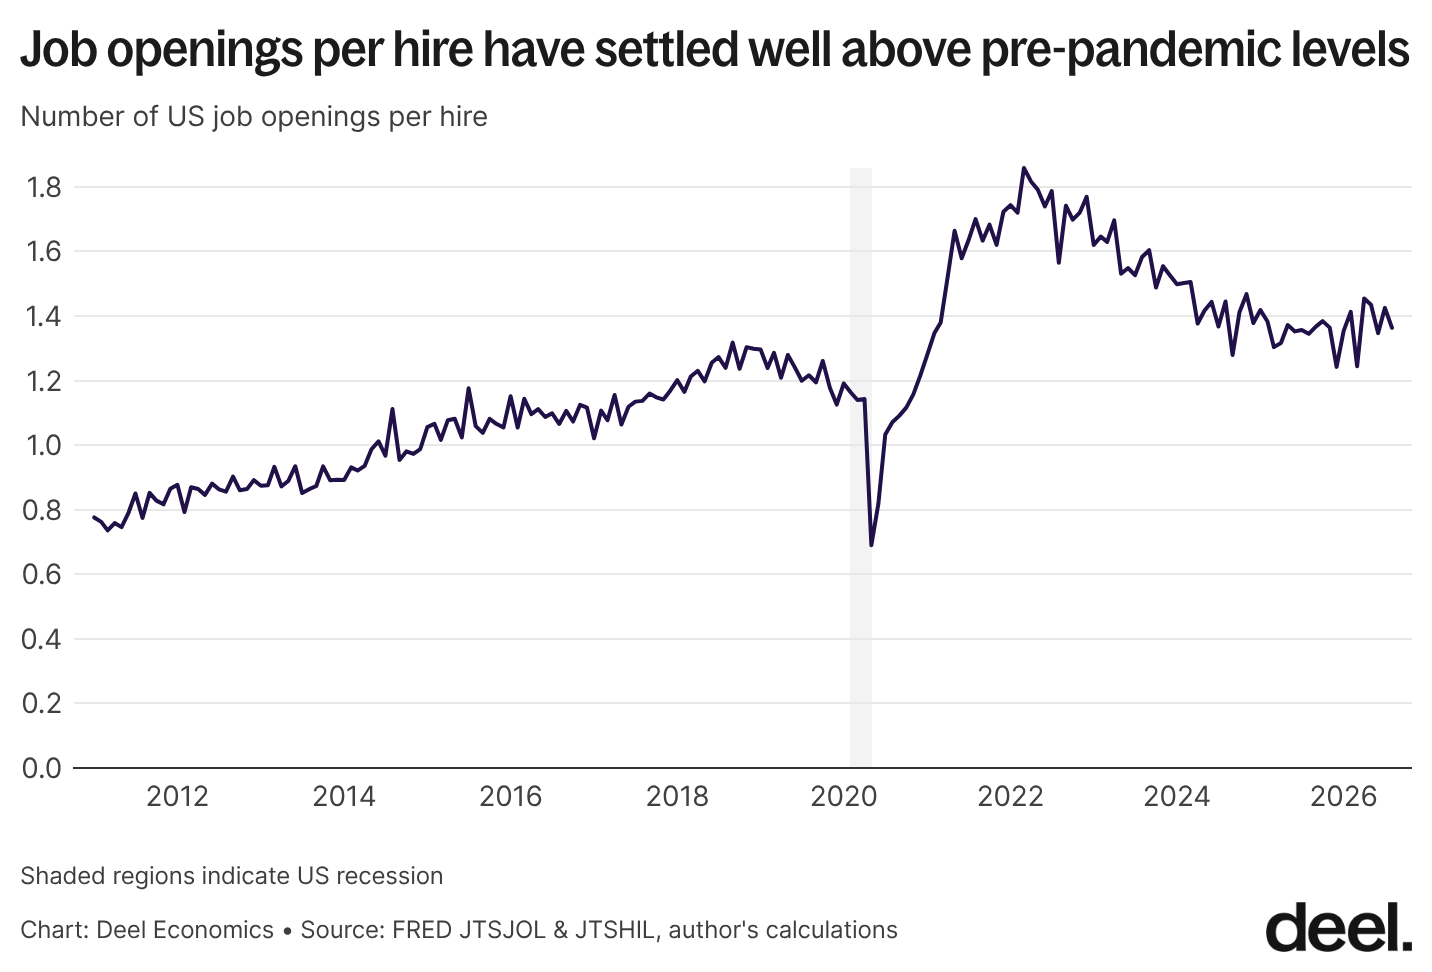
And yet clearly workers’ sentiments about job market health are closer to that of the early post-GFC period than what we saw in 2019 – which makes sense. It’s one thing to see job openings, but what really matters to you as a worker is probably going to be actually getting hired.
So, what’s going on – why are we seeing this disparity? A few potential explanations present themselves:
Data quality issues: A new hire is easier to define than a job opening. We know that the BLS, like its counterpart over the pond, has been beset by data quality issues since the pandemic: it may be that these issues are disproportionately impacting the measurement of more nebulous metrics like job openings.
Openings are a weaker signal of hiring demand than they used to be: employers might be more likely to post jobs that they don’t actually intend to hire (‘ghost jobs’) or leave up evergreen job posts (think ‘software engineers’ for a big tech company or “sales” for, well, basically anyone) for longer.
Vacancies are taking longer to fill: vacancies remaining open for longer will push up the number of openings relative to hires. This could be occurring for a variety of reasons: the number of applicants for each job has shot up (thanks to easier application processes and the use of AI in applications), so it takes a longer time to sift through applicants; there may be a mismatch between the skills employers are looking for and what workers already have (doubly so at times of structural shifts in the economy, which it looks increasingly like we’re experiencing now); and there could simply be a compositional shift in who’s hiring, from industries that hire quickly to those hiring much more slowly.
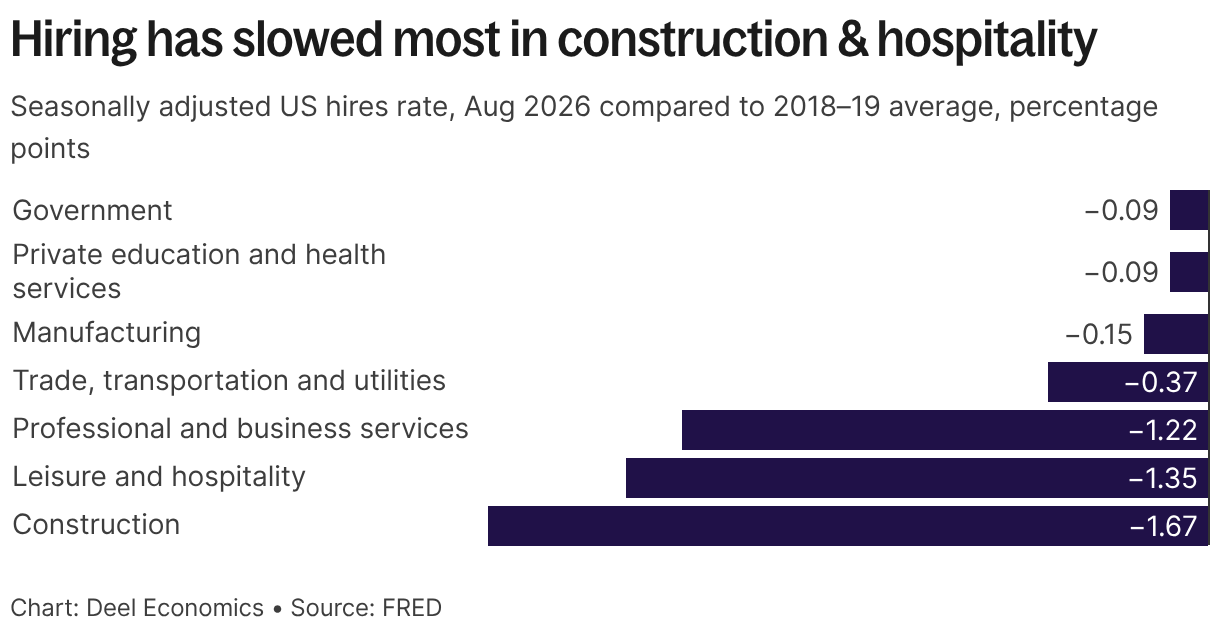
And indeed, the chart below shows that while hires and quits rates are below pre-pandemic averages in every industry, some industries have been particularly hard hit, with business services, construction, and leisure & hospitality chief amongst them. I’d guess the latter two industries have particularly quick hiring processes: so a shift away from them probably explains some of the change in the job openings to hires ratio.
Government and private education and health services, on the other hand, have seen the smallest falls in hiring rates.
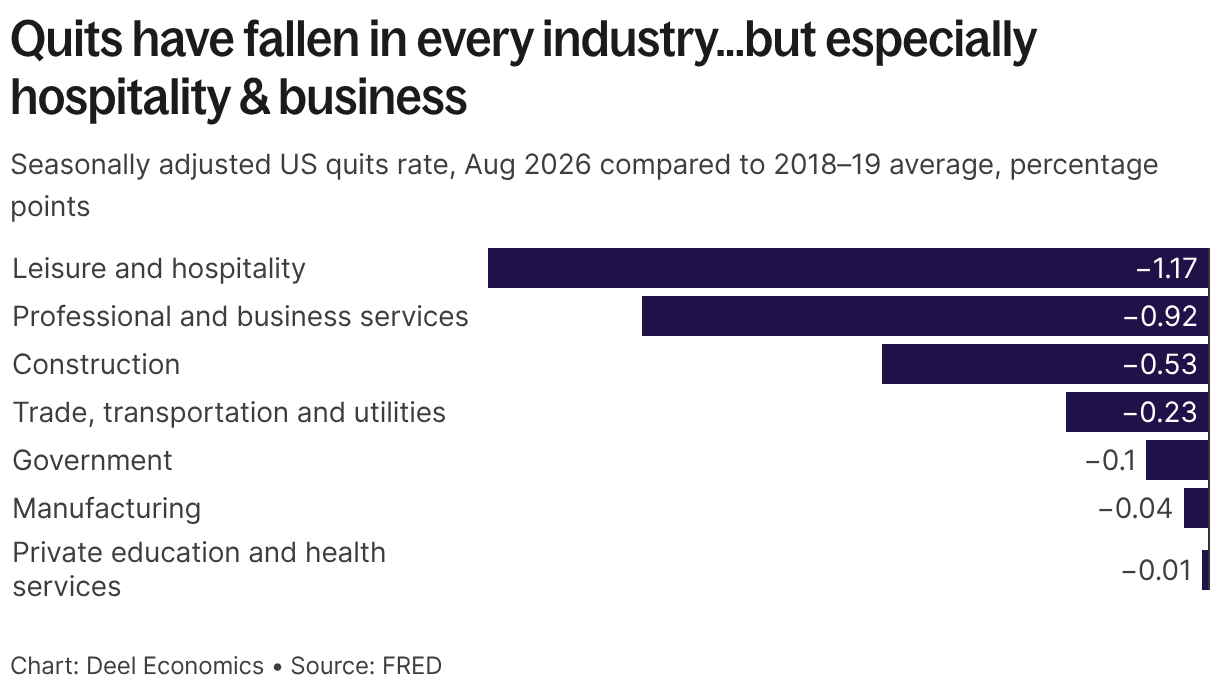
We see similar patterns in quits rates: private education and health services have fallen the least, and leisure and hospitality the most. That’s a useful reminder of two things. First, hires and quits are closely linked, since job-to-job moves account for the vast majority of quits. Second, the leverage workers had in leisure and hospitality during the pandemic recovery, when employers struggled to fill roles and wages rose fastest at the bottom of the market, is well and truly over.
Though we don’t have seasonally adjusted data for information and communication, persistent weakness in payrolls suggests that it would join leisure & hospitality and professional & business services (an industry which itself overlaps greatly with information) near the bottom of the chart here.
One last thought to end on here: the underappreciated bright side of the JOLTs data is that the overall job market isn't getting any weaker and hasn't been for months now. The downside is that the weakness seems to be persistent.
It reminds me of how inflation stayed consistently low post GFC, even with the Fed keeping interest rates near zero for years. It wasn't until the impact of a global pandemic hit that we saw anything different. Are we going to need something similarly drastic here?
The morning after
Payrolls rose 29,000 in September
Payroll employment in the US rose by 29,000 in September, coming in below expectations of 90,000.
Last month, I wrote that the BLS’s regular revisions mean we shouldn’t read too much into August’s unusually buoyant payroll increase, and this month’s release bore that out: August and July were revised downwards by about 60,000 combined, more than twice the 29,000 added in September.
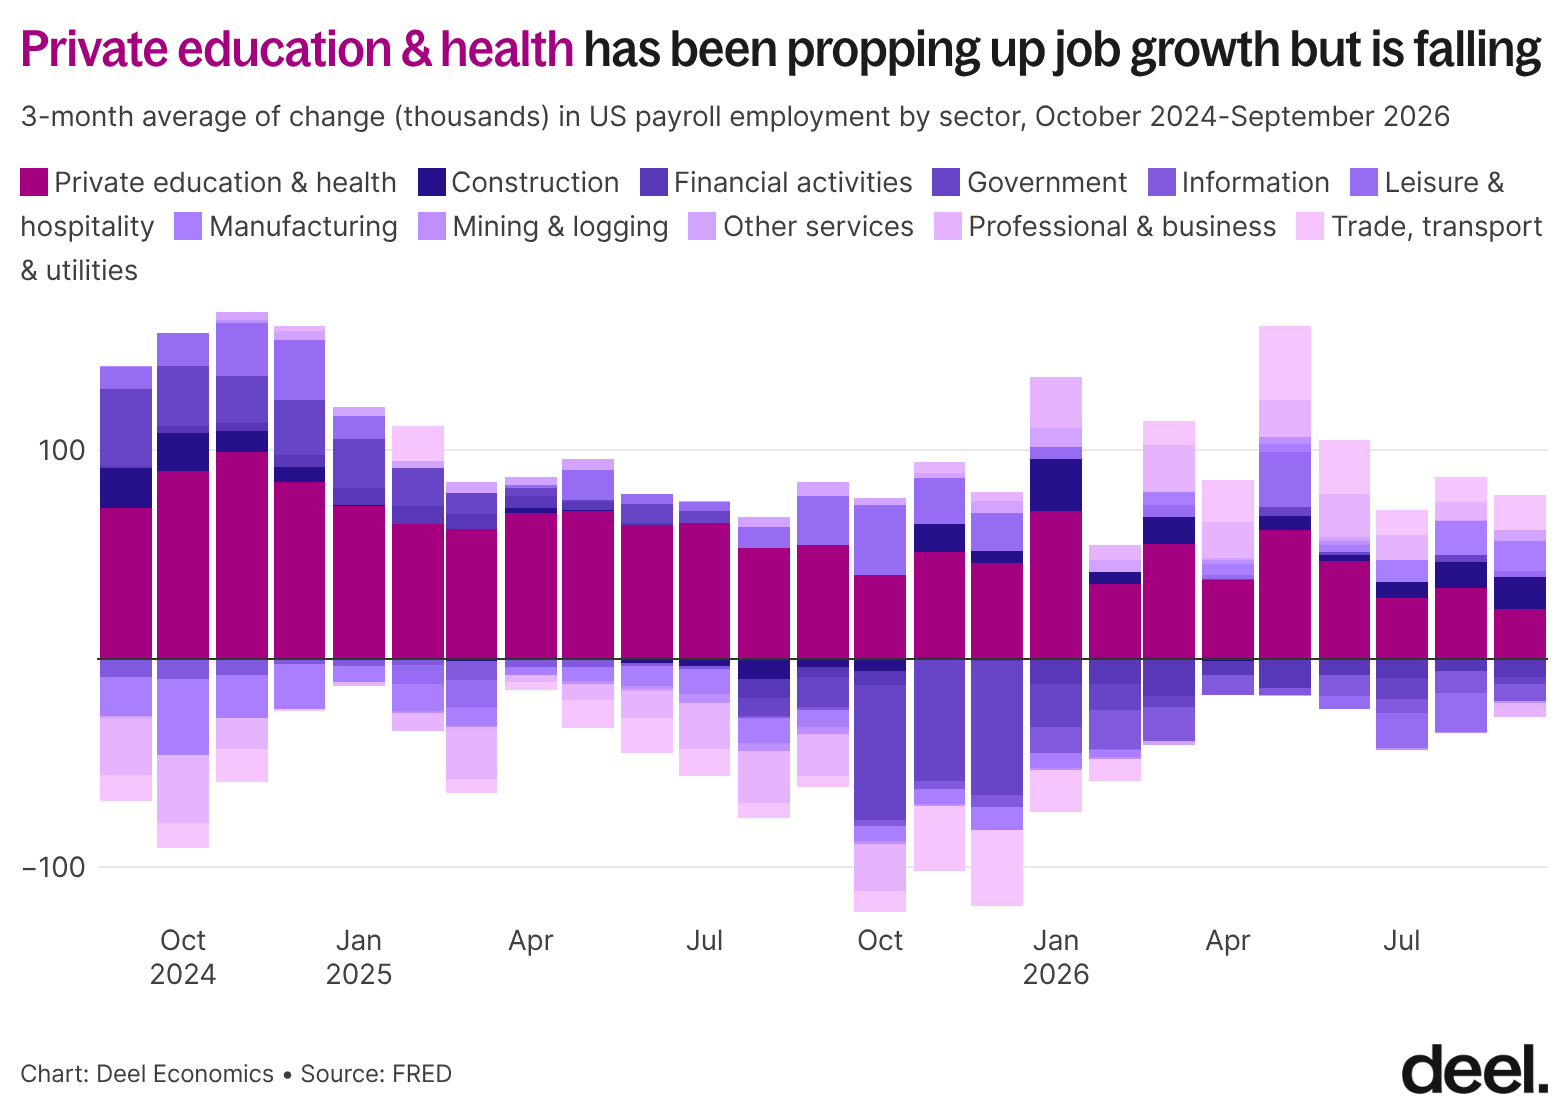
The chart below shows the three-month moving average of monthly payroll changes by sector over the past two years. Private education and health services has driven most of the growth: over that period it added 1.3 million jobs, while total payrolls rose by just 1.1 million. That means everything else combined has shed about 200,000 jobs. But it’s clearly slowing: it added an average of about 66,000 jobs a month in the year to September 2025, versus 43,000 a month since.
On a more positive note, most sectors outside private education and health have added jobs in most months since March, after a difficult 2025. Diversification is good, since it means the job market is less dependent on a single sector. But healthcare has served as such a reliable source of jobs that a continued slowdown will mean the rest of the economy will need to add much more than it has so far.
A rounding error, mostly
Unemployment is 4.2%, and the rise has stopped
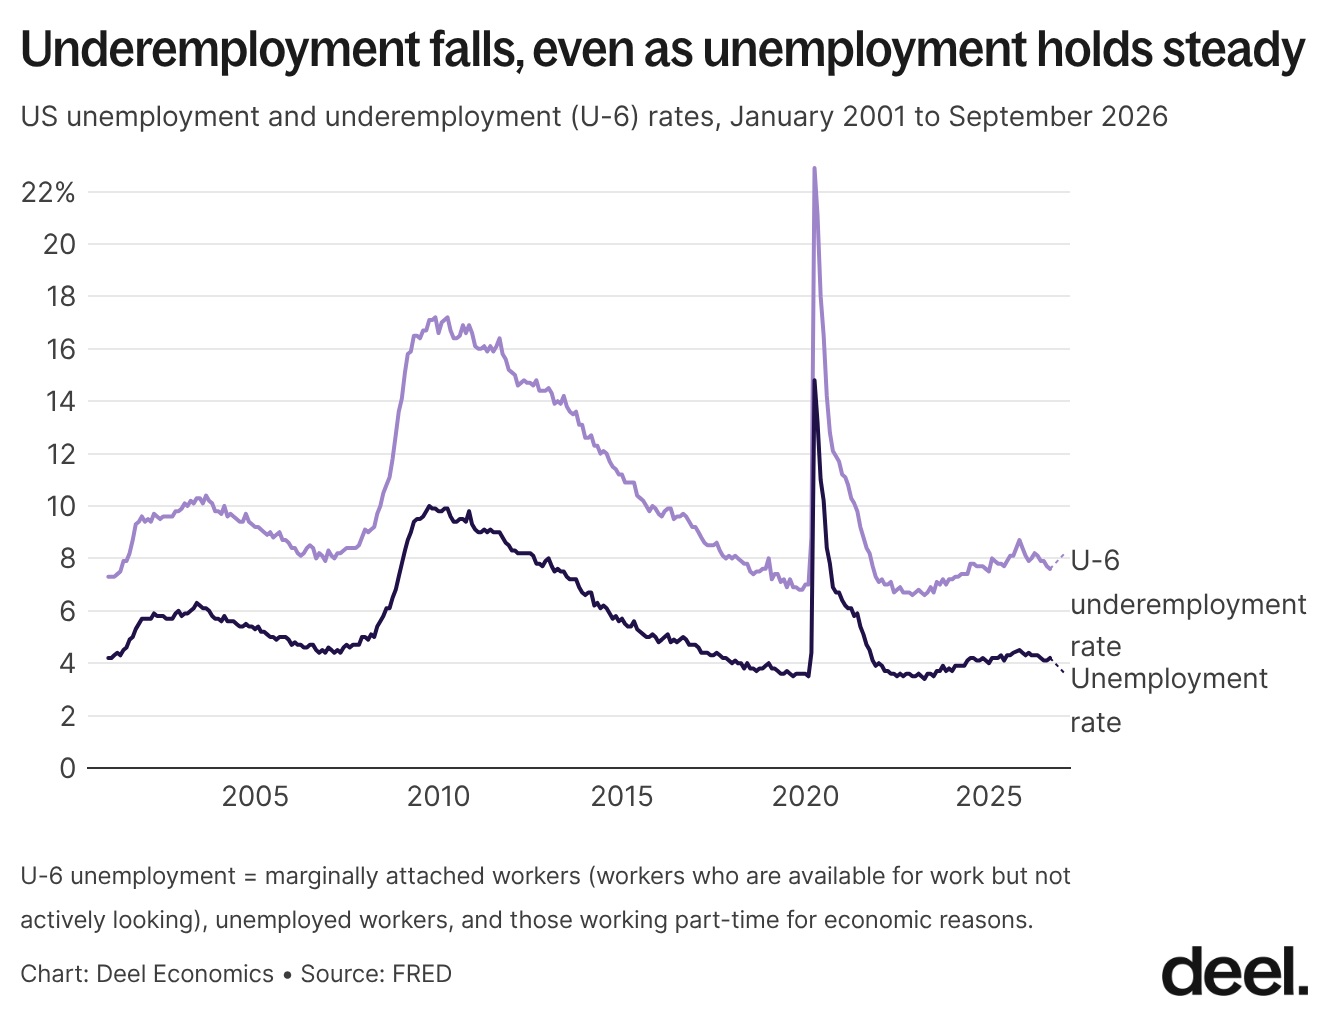
Plenty of news reports highlighted the rise in unemployment from 4.1% to 4.2% as a potential sign of concern – but most of this was essentially a rounding error; the change between the two months was actually only about 0.03 pp (hat tip to Aaron Terrazas for being the first to point this out).
Taking a step back shows the unemployment rate is actually mostly good news. Unemployment has clearly arrested the rise that it was on between late 2022 and late 2025. And underemployment, which in times of economic distress can be a better way to measure what is going on, has been continually falling for nearly a year now.
UK
How low can it go
Vacancies fall below 700,000 for the first time since early 2021
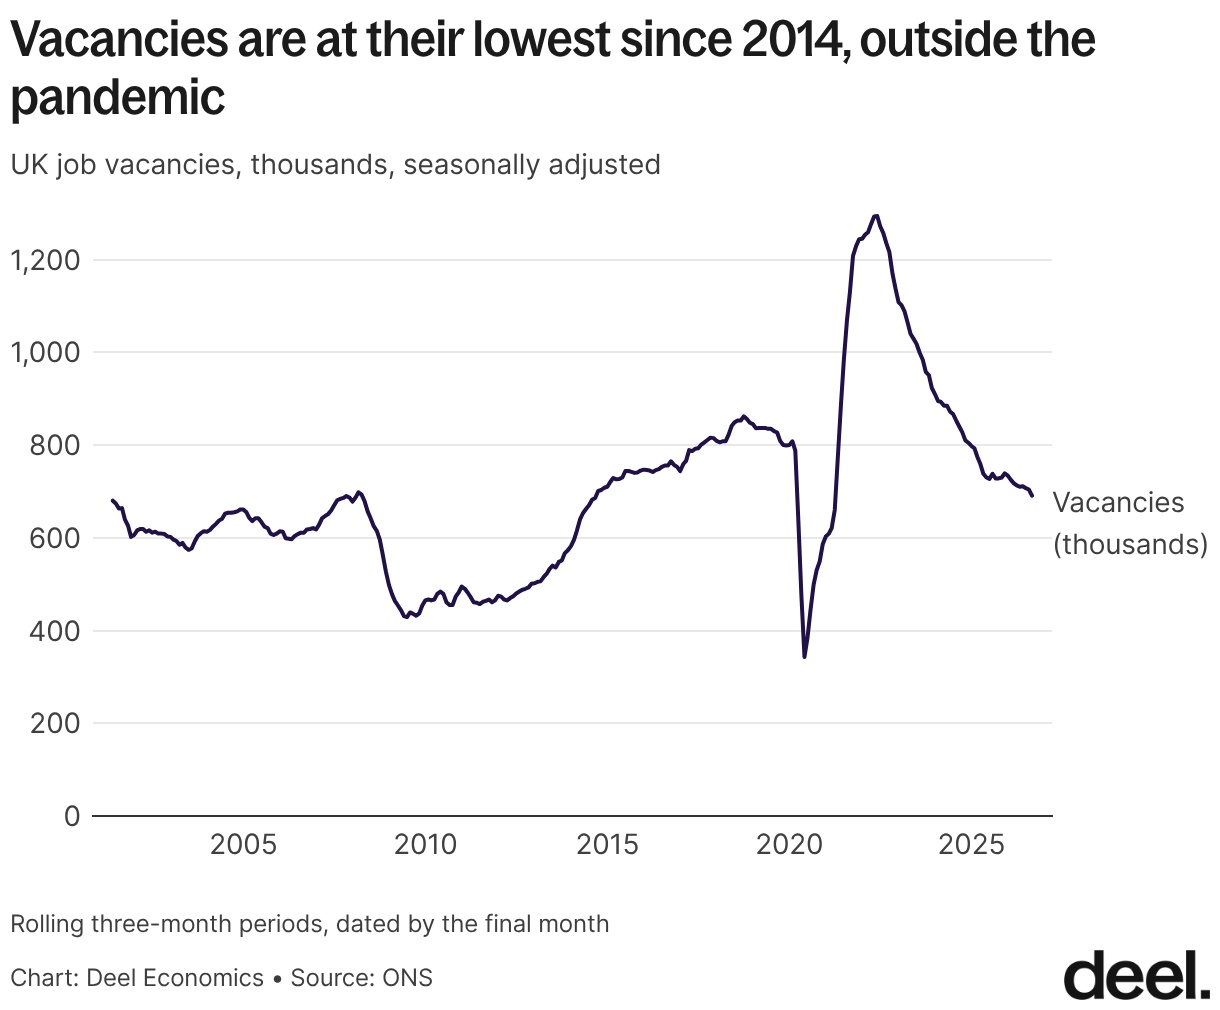
Vacancies fell to 691,000, the first time below 700,000 since early 2021. The ONS says small firms are pulling back because of higher labour costs. Though they don’t specify exactly why, there’s no doubt overall labour costs have increased: wages since 2021 have jumped by nearly a third in nominal terms, National Insurance costs for employers have risen, and the minimum wage has gone up again since.
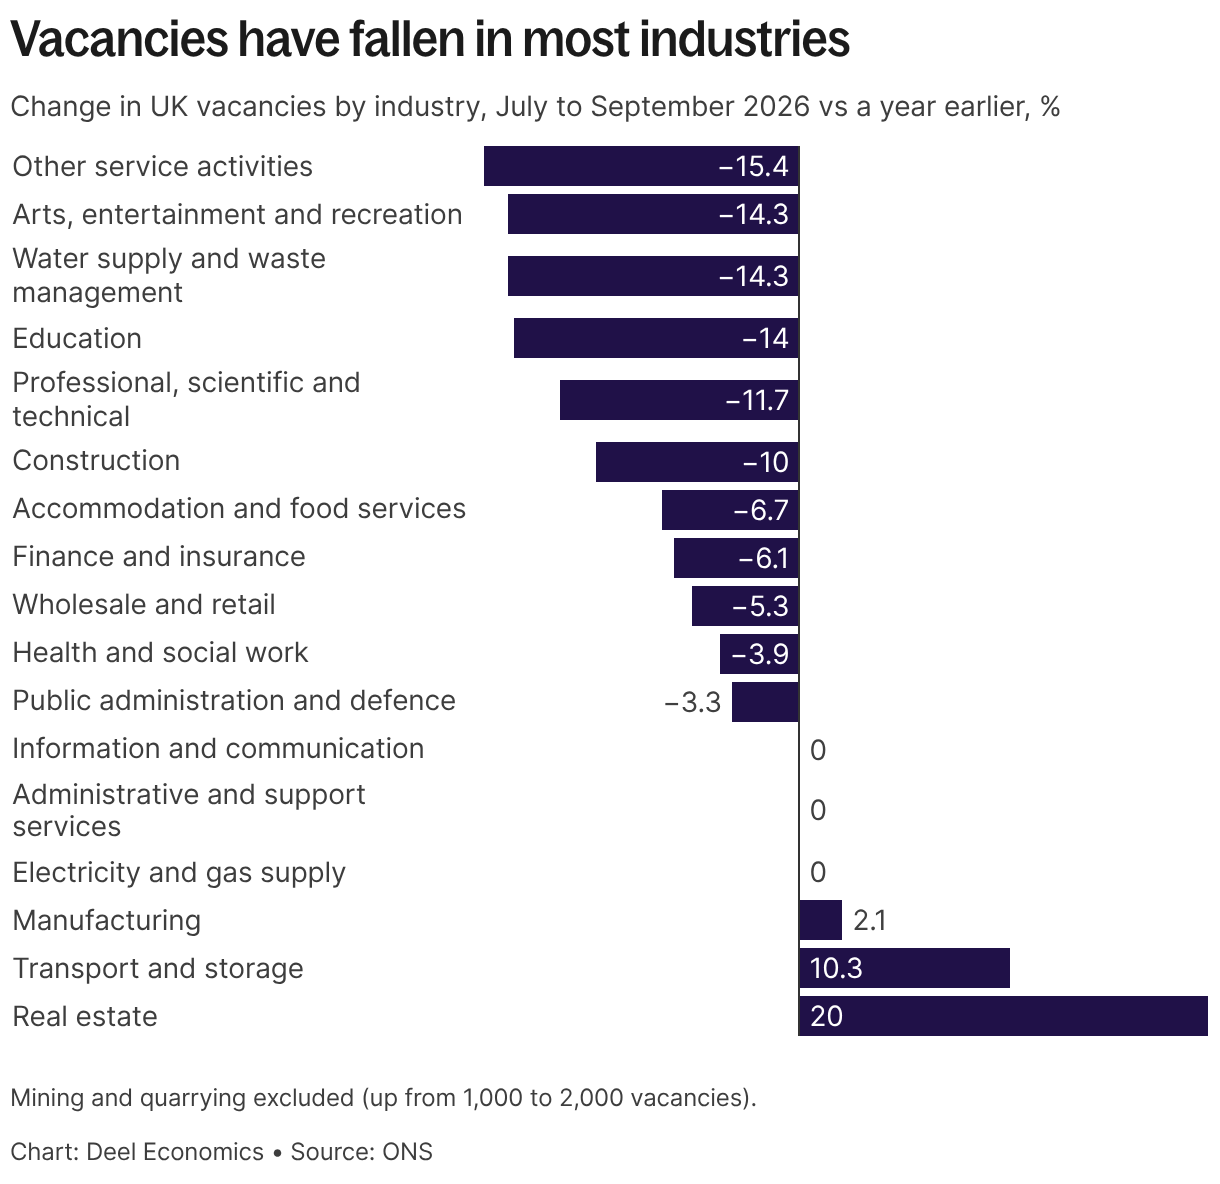
The fall in vacancies is broad: compared with a year ago, they’re down in eleven of the seventeen industries featured in the chart below. The biggest drops are in other services (-15%), arts and entertainment (-14%), water supply and waste (-14%) and education (-14%), with professional services (-12%) and construction (-10%) not far behind.
Accommodation and food services (-7%) and wholesale and retail (-5%) are down by less, but those are the industries where I’d expect higher labour costs to bite hardest, since they’re full of small firms and low pay. Health and social work (-4%) and public administration (-3%) have held up best among the big sectors, reflective of the same pattern we saw in the US.
Sweater weather
Unemployment falls to 4.7%, and the employment rate rises to 75.3%
Unemployment fell to 4.7% in June to August, down 0.1 percentage points on both the quarter and the year, and the employment rate rose to 75.3%. That's good news, especially considering unemployment was as high as 5.2% early this year – and an interesting parallel with the US, where unemployment has stopped rising and is now flat at 4.2%.
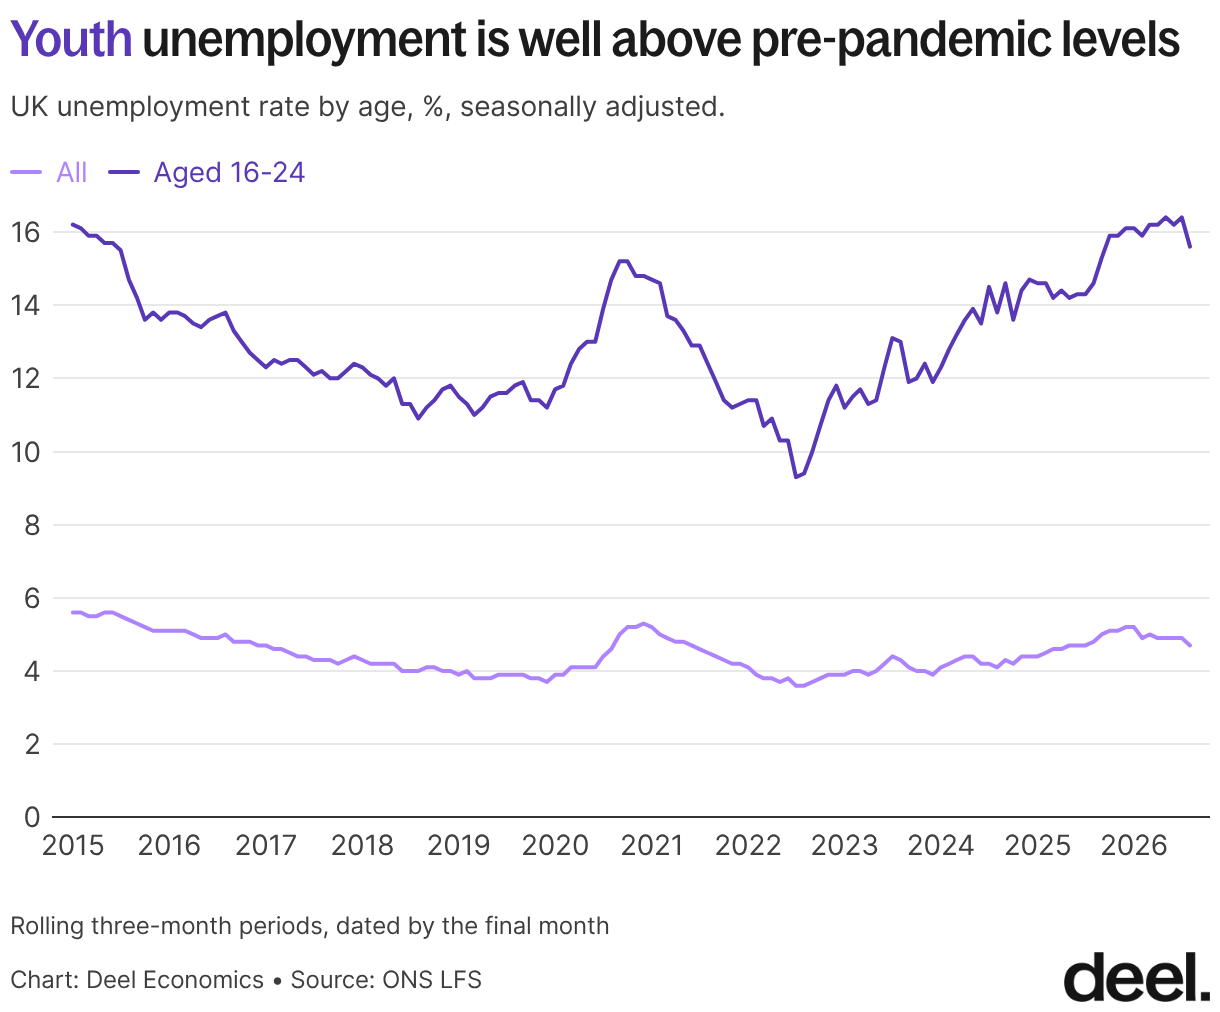
For those aged 16-24, however, the picture is not as rosy. Despite a drop in unemployment in this age group from 16.4% last month to 15.6% this month, the overall picture is that of a big increase. It’s clear that overall weakness in the labour market translates to much bigger impacts on the youngest amongst us, and really it’s no surprise: the young are the biggest unknowns in the labour market, and therefore the biggest risks for a potential employer. If higher labour costs really are the reason why firms are pulling back, they’re likely to hit young people the most. Of course, AI is an easy explanation here, but in my opinion an incomplete one: AI adoption is still nascent and the number of jobs it could replace is small. The overall weakness of the job market is a much bigger factor.
Worse, long-term unemployment among 18–24 year olds (over 12 months) is up nearly 30% on the year to 145,000, the highest since 2015.
The case of the missing payrolls
Payrolled employees are down on the year, but roughly flat on the month
Payrolls are weaker: 66,000 fewer payrolled employees than a year ago in September, though roughly flat month on month. Why are payroll figures and unemployment moving in step when they should be opposites? I covered this in detail last month, but it could be any combination of self-employment, lower workforce growth thanks to plummeting migration, or separate datasets (LFS is a survey, payroll data comes from HMRC).
We’re likely to have an update on yearly migration data from the ONS next month, which should help show how much of the gap comes from a shrinking workforce.
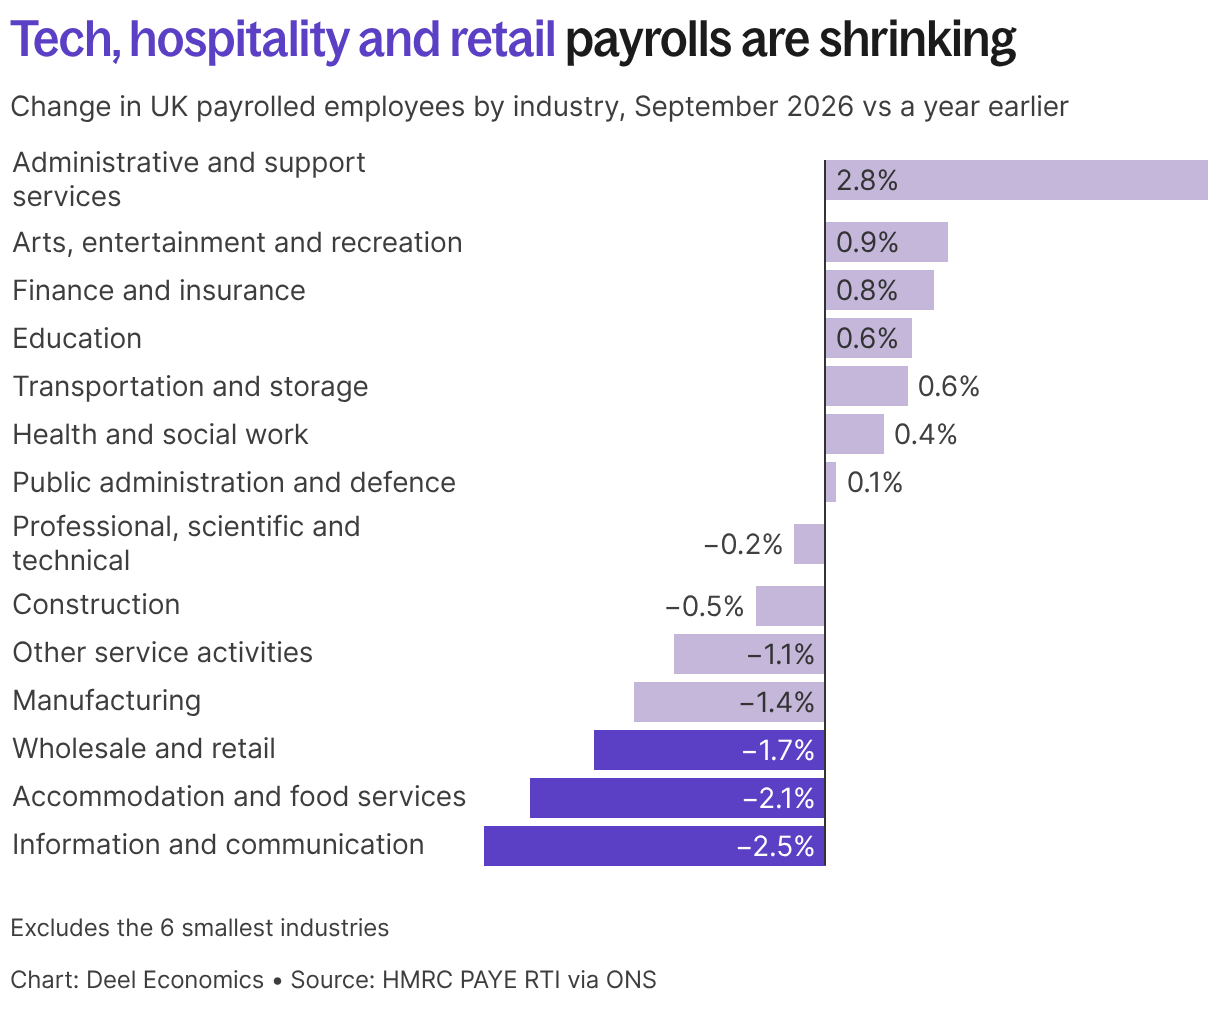
Payroll employment by industry reveals a contrasting picture. Interestingly, admin and support services added above 60,000 payrolled employees over the year, while wholesale and retail lost about 71,000.
Information and communication had the steepest fall in percentage terms (-2.5%), which mirrors what we’ve been seeing in the US.
Treading water
Total pay growth falls to 3.7%, its lowest since 2020
Total pay growth slipped to 3.7% in June to August, down from 3.9% and its lowest in almost six years, though regular pay has been stuck at 3.7% for six periods in a row. Once inflation is accounted for, however, regular pay is up just 0.6% and total pay 0.7%. And it’s the real figures that matters more to workers: that’s what their pay will actually cover.
Private sector regular pay is growing at only 3.0%, while the public sector is at 6.3% (largely due to the timing of pay rises rather than a big difference in amounts).
The fine print
Long-term sickness falls
One underappreciated change in the UK labour force has been the decline in those who have exited the labour force due to long-standing illness. This rate skyrocketed after covid, and although it hasn’t returned to its pre-pandemic level, it’s been falling this year. Over the past year, the number of long-term ill has fallen by 86,000, going from 31% of the economically inactive population to 30.1%. That’s a relatively small but meaningful decline.
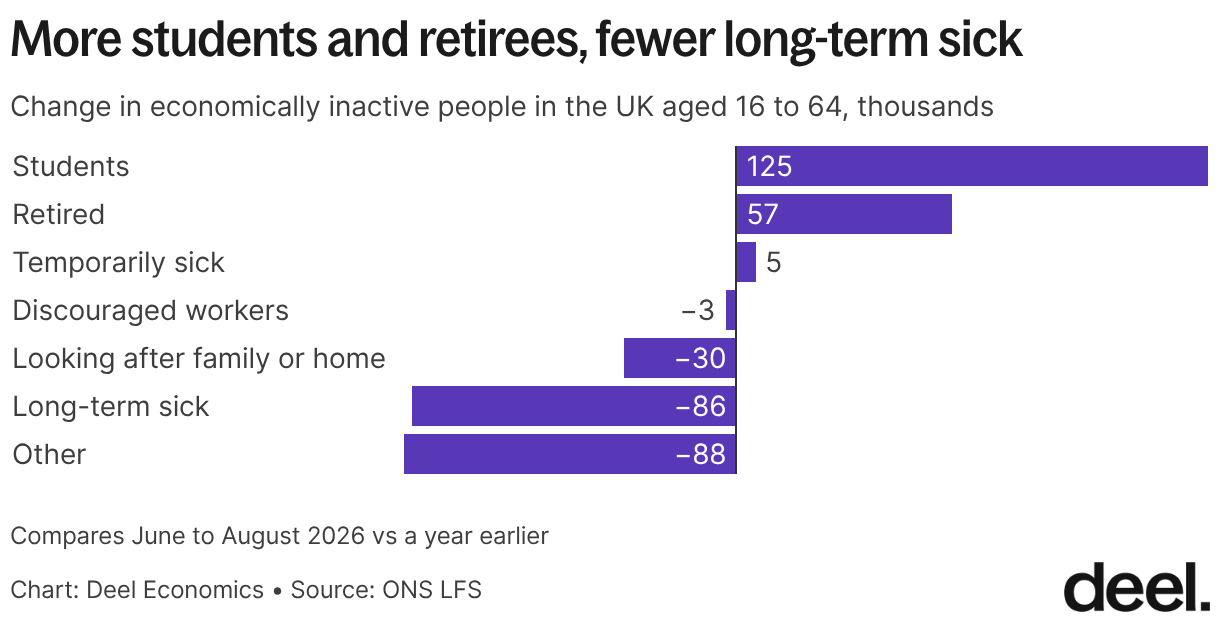
The rise in students is interesting, and may be a response to the continued weakness of youth employment: continuing or returning to education is a common response in such situations.
Data deep dive
Frequent-flyer startups
Last month, I was on a panel at FDDay in Paris to talk about scaling abroad, so I pulled some data to illustrate my hypothesis: that many software companies are going international now almost by default.
An obvious but perhaps underappreciated point: not only is scaling bits far easier than scaling atoms, selling software and services across borders avoids much of the friction that comes with physical goods. Tariffs and customs checks apply mainly to goods, and services are often taxed more lightly. Many US states, for example, don’t charge sales tax on software or services at all.
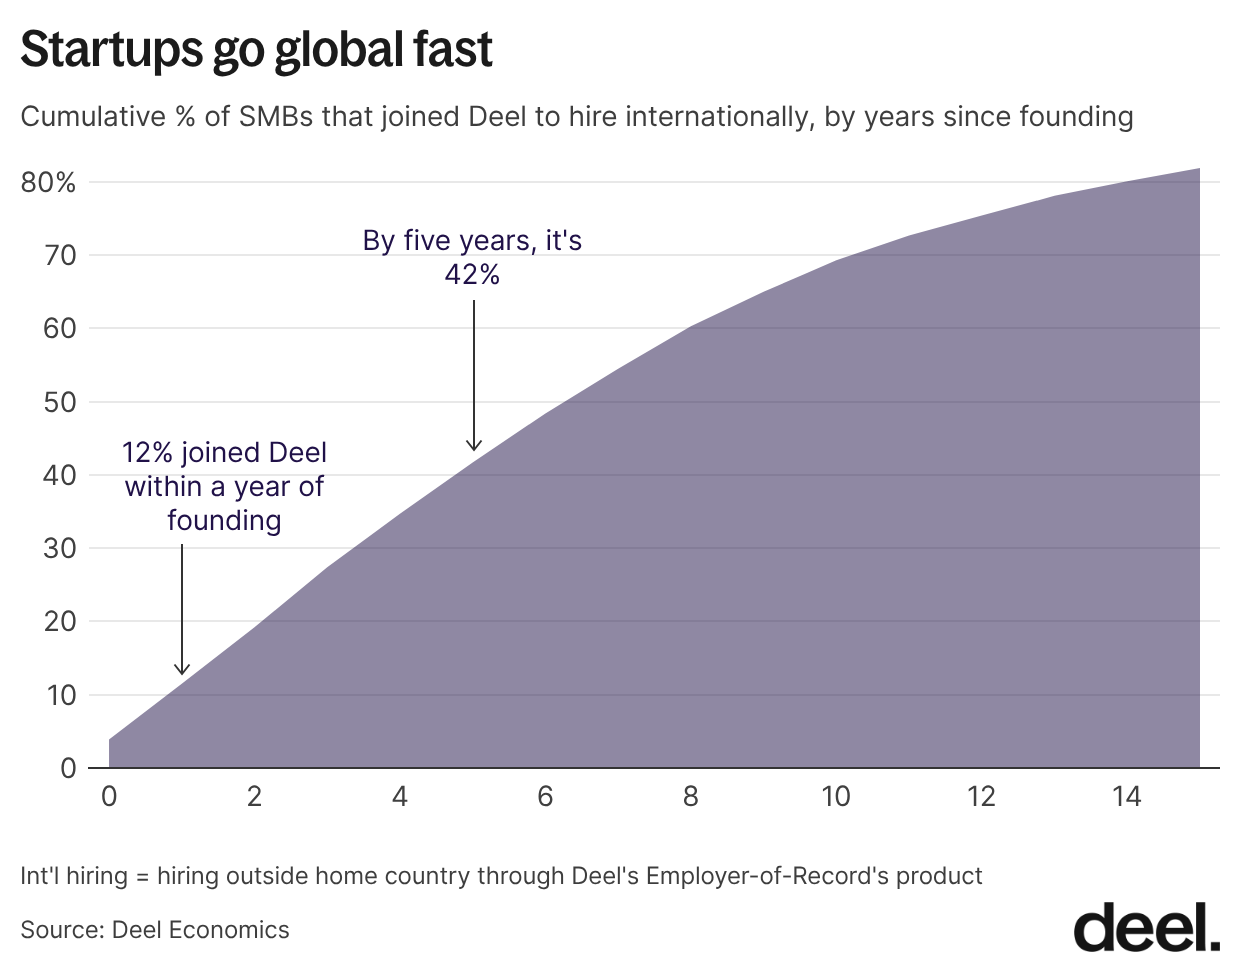
That means startups can sell into new markets early with little regulatory friction. Hiring has followed suit. The employer of record (EOR) model and the pandemic’s normalisation of remote work have made cross-border teams for many companies standard from day one. Among the SMBs that hire through Deel’s EOR, more than 10% started within a year of their founding, 42% within five years, and 70% within a decade.
We also see clear patterns in where companies hire first. Across our SMB customers, the most common first market outside their headquarters country is Canada, followed by the UK, the US, Germany, Spain, and France. When we look at individual HQ countries, those first moves are mostly explained by location, language, and the availability of skilled workers. Cost and tax considerations matter much less than you might expect at this stage.
That’s it for this month’s roundup – see you next time!
Table of Contents