Article
11 min read
Silicon Valley engineers don’t have equity all to themselves (anymore)

Author
Lauren Thomas
Published
September 01, 2026


Key takeaways
Equity is global, not just Silicon Valley: 8,000+ employees across nearly 100 countries have received equity via Deel in the last four years, and ~30% work at AI companies.
APAC is catching up fast: APAC's share of new-hire equity grants has more than doubled since 2022; North America is no longer the outlier it once was.
US still leads, but the gap is narrowing: US firms grant equity to 44% of their workforce on average (vs. Germany, UK, France, Netherlands) and remain 12pp overrepresented in Deel Equity vs. Deel's customer base overall.
Equity is spreading beyond engineering: Sales roles jumped from 18% to 27% of EOR equity grants since 2023, narrowing the gap between "equity-favored" and other functions.
Why it matters: US tech's dominance doesn't have to be zero-sum — as American companies hire and grant equity abroad, they're sharing wealth beyond Silicon Valley – but this is not a panacea.
Welcome to another chart deep dive from the Deel Works team, looking at where equity goes. Anthropic and OpenAI’s potential IPOs have made equity a California conversation, but the implications go well beyond the Golden State. Employees starting in the last four years who’ve received equity through Deel number over 8,000 across nearly 100 countries. That’s a big enough sample to look at what “equity compensation” looks like as it spreads beyond Silicon Valley: how much, where, to whom, and where the pattern is shifting.
We’ll start with the usual caveat that all anonymised and aggregated data below comes from companies using Deel’s Equity Services, so it skews toward startups, tech firms, and remote-first companies. This is where equity as a compensation practice is spreading most quickly. It’s particularly popular among AI companies, which we define using a two-part test: would the core product cease to exist without AI or ML, and was AI/ML present at founding? That covers both classical ML products (such as computer vision powering self-driving cars) and generative AI. Nearly 30% of employees granted equity through Deel work at AI companies, well above the overall proportion on Deel’s platform.
Welcome, please accept your grant
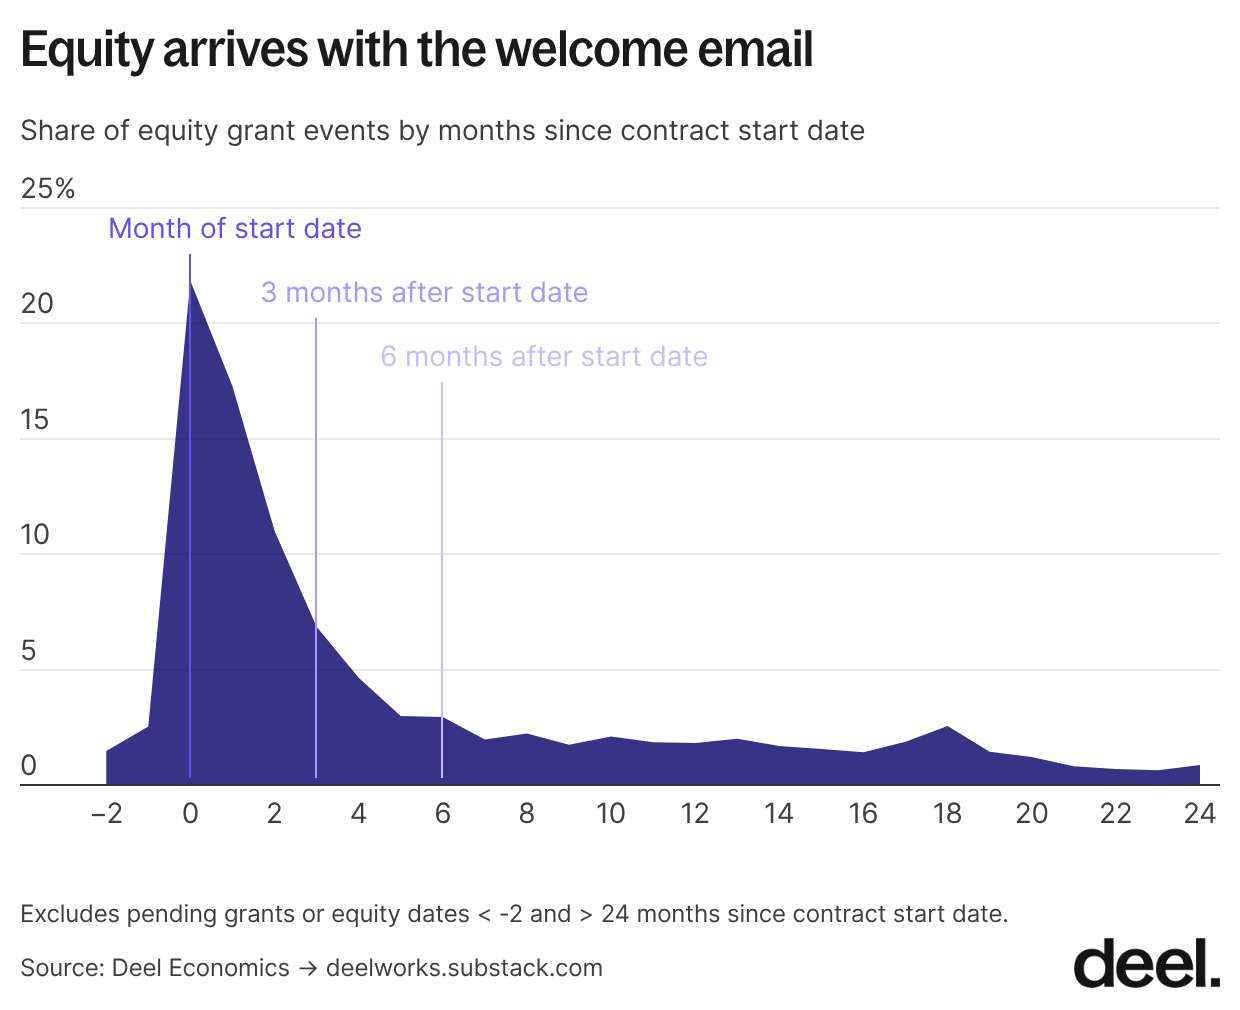
Most equity grants land within three months of the new hire’s start date. But the tail is long, and some grants show up a year or two in.
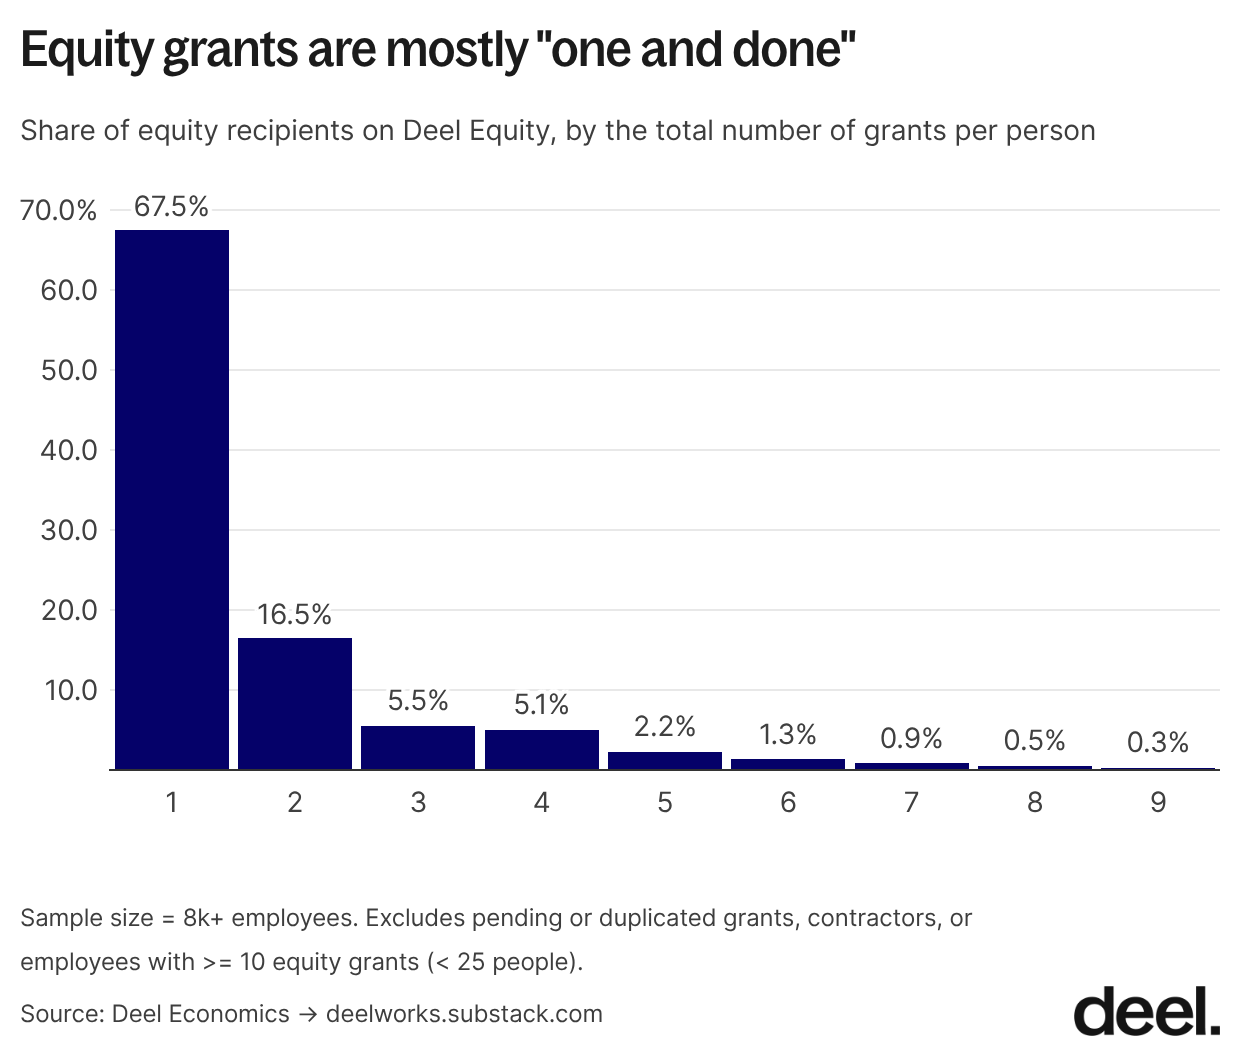
Most employees (67.5%) only ever receive a single grant from their employer - no top-ups. As Deel’s equity customer base is mostly startups, this trend is likely more representative of small, recently founded tech companies than older and more established companies.
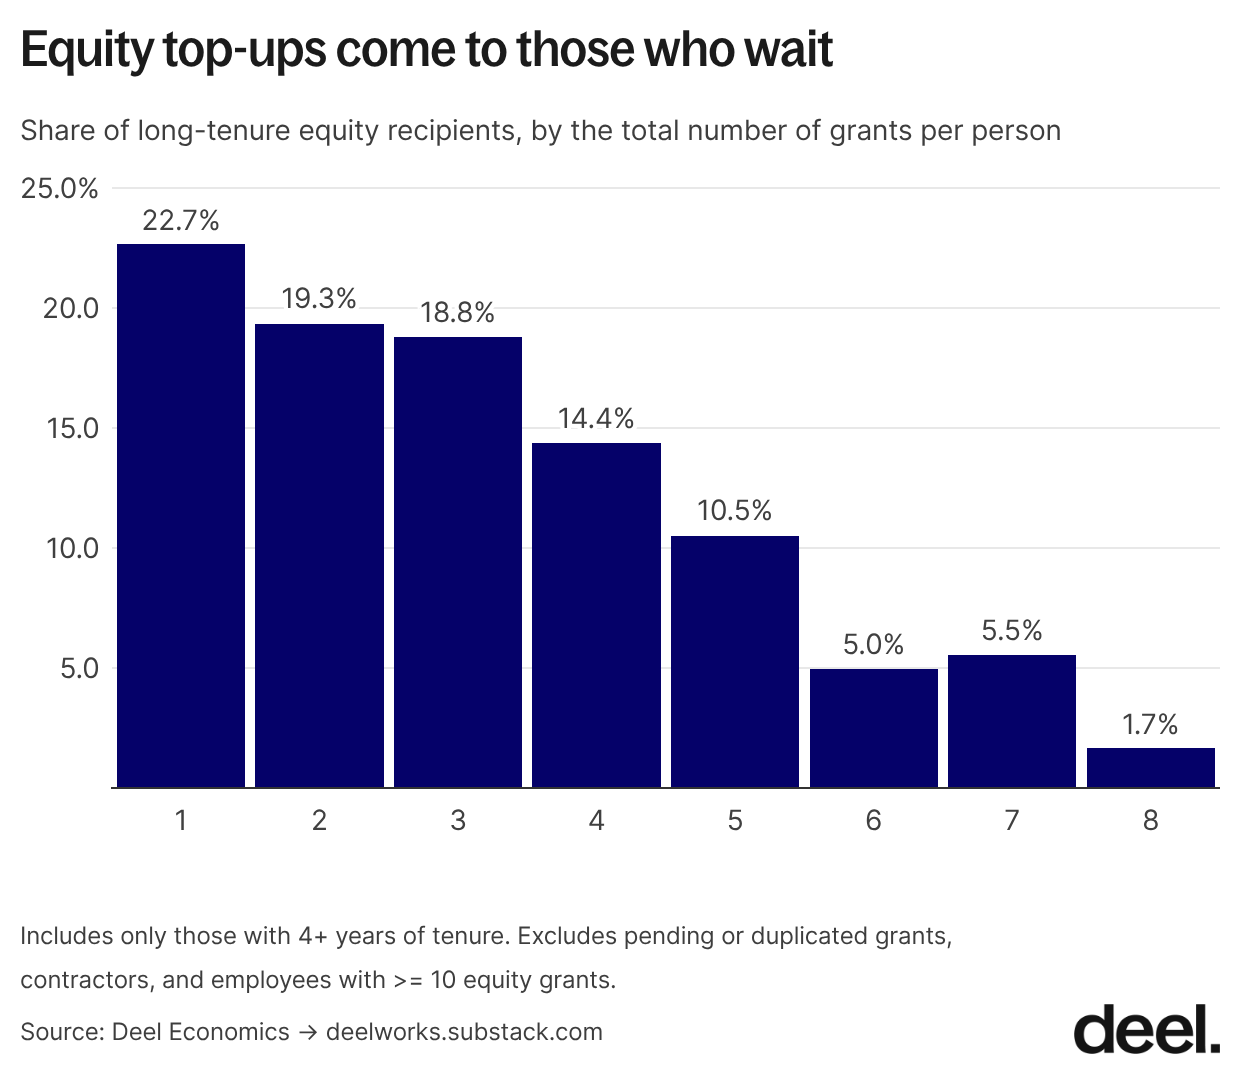
That said, most of that gap is tenure. Look only at employees who’ve been around 4+ years, and the share with just one grant falls to 22.7%. Fair warning: four-year tenures are rare in this data, so I wouldn't lean on the number too hard.
Equity becomes a global currency
There’s some evidence that companies are expanding equity programs across countries over time
Deel’s Employer of Record program allows companies to hire employees compliantly in countries in which they don’t have a legal entity, and it’s been around since the company’s founding in 2019. This means it’s the perfect route to look at foreign equity issuance.
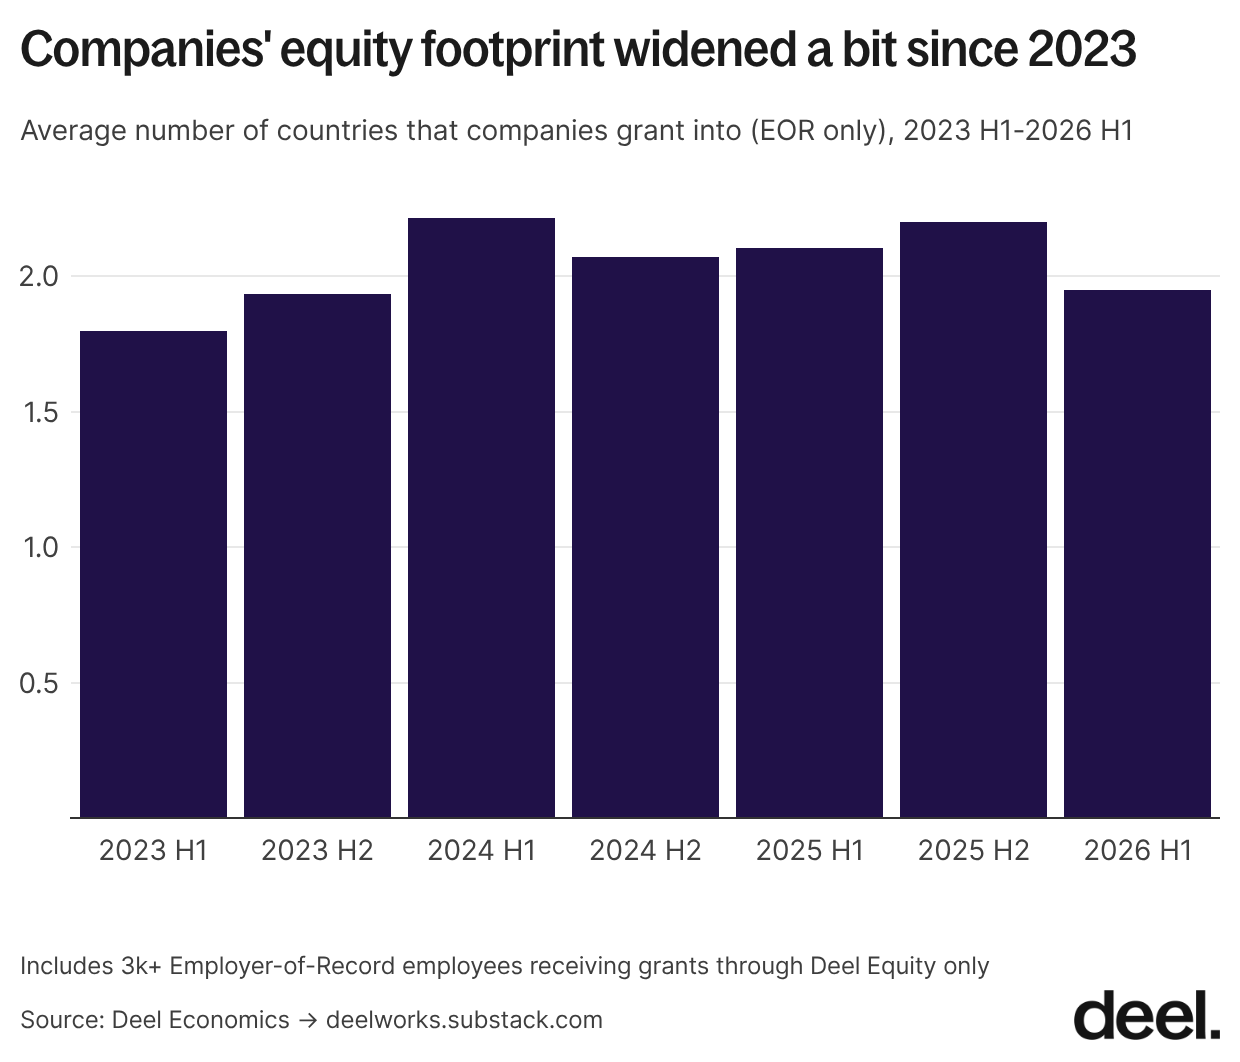
We can see that the average number of countries where an organization grants shares to its EOR employees has risen slightly (albeit not statistically significantly) over time, from just over 1.80 in H1 2023 to 2.20 in H2 2025, before dipping slightly to 1.95 in H1 2026.
When looking only at organizations that hire across multiple countries, the rise is more pronounced (and statistically significant) - from 3.19 in H1 of 2023 to 4.25 in H2 of 2025 and 3.93 in H1 of 2026.
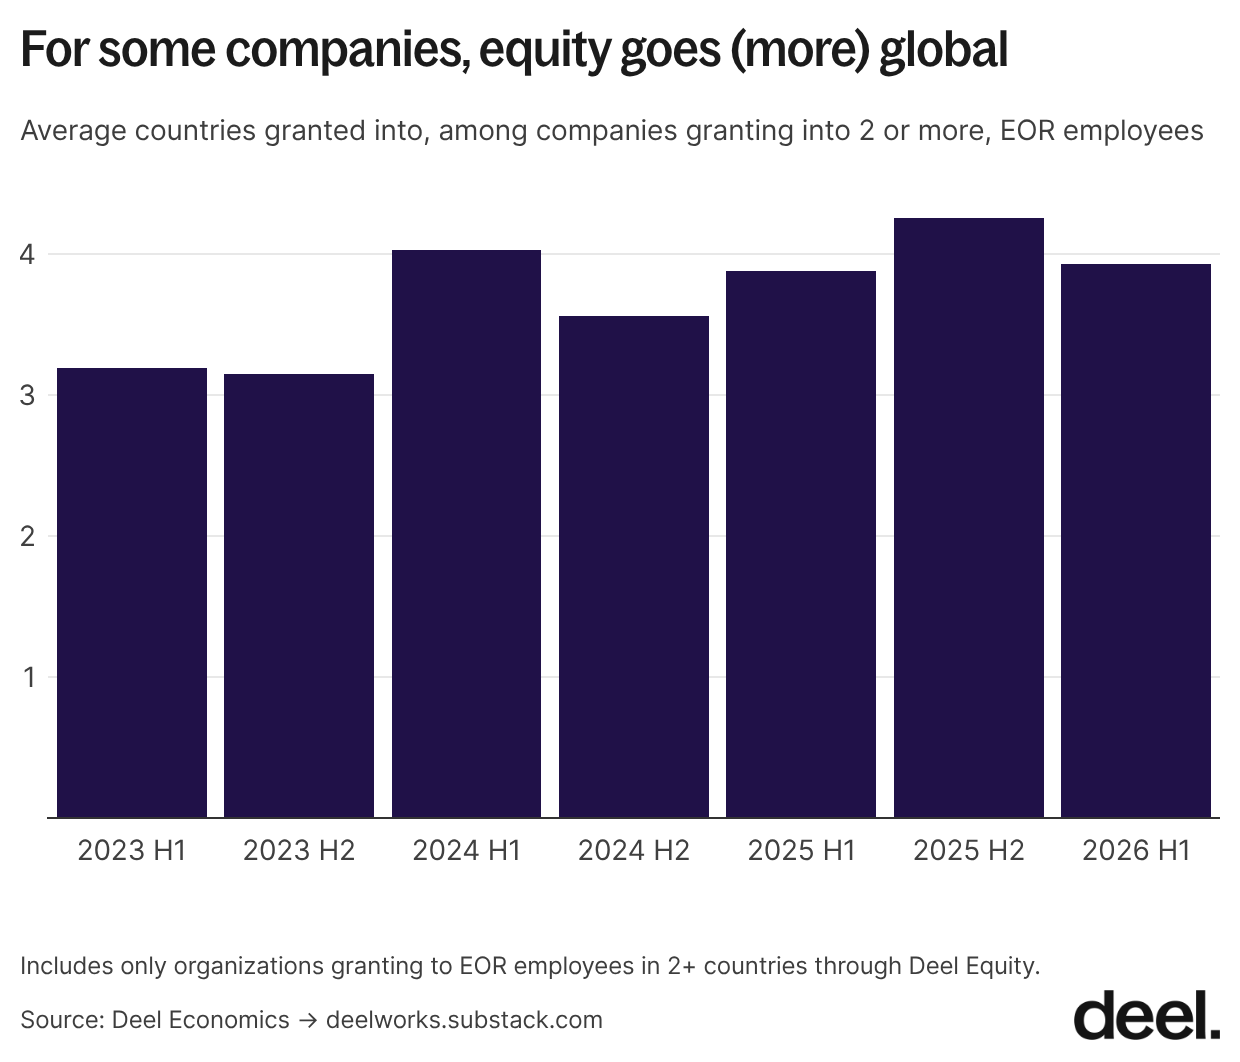
Companies are widening the net for where equity goes
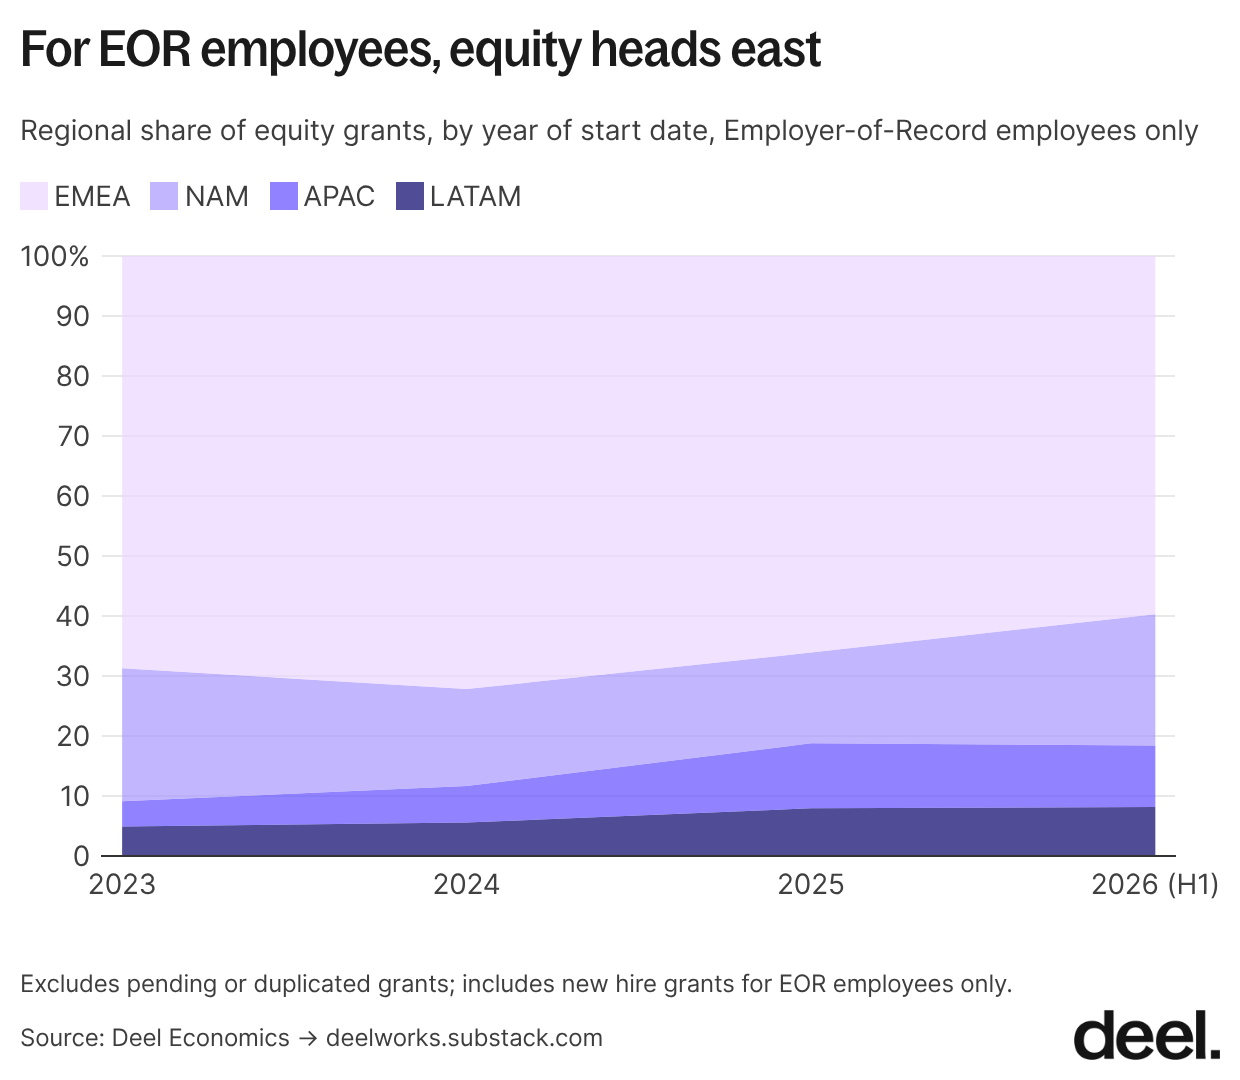
Mapping the share of grants by employee location highlights this regional growth even more clearly. Of new EOR hires who received equity in 2023, 69% were located in Europe, the Middle East & Africa (EMEA), although almost all these come from Europe. By the first half of 2026, this share had fallen to 59%. North America and Asia-Pacific (APAC) took most of this slack, with APAC’s share of grants more than doubling from 4% in 2022 to 10% in 2026.
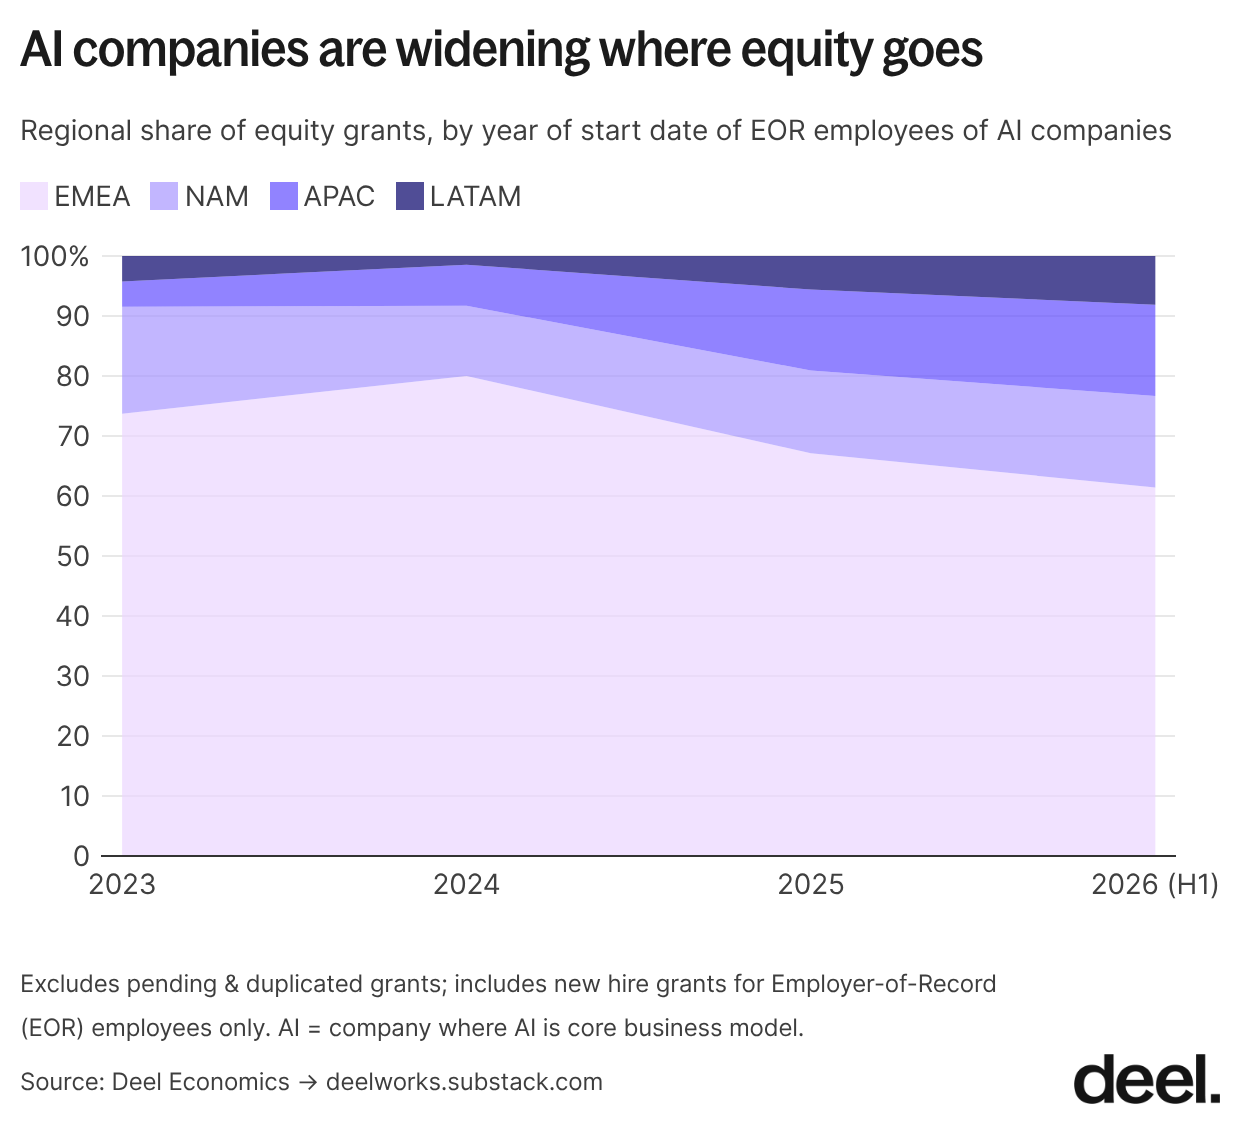
We see the same pattern amongst EOR employees of AI companies, with EMEA falling from a peak of 80% in 2024 to only 61% in 2026 H1. Both APAC and Latin America (LATAM) more than doubled, although North America’s share grew as well, from 12% to 15%.
Amongst non-EORs, North America dominates, and its share has continued to grow over the past several years - this pattern holds even when excluding those on Professional Employer Organization (PEO) contracts, which are exclusive to the US.
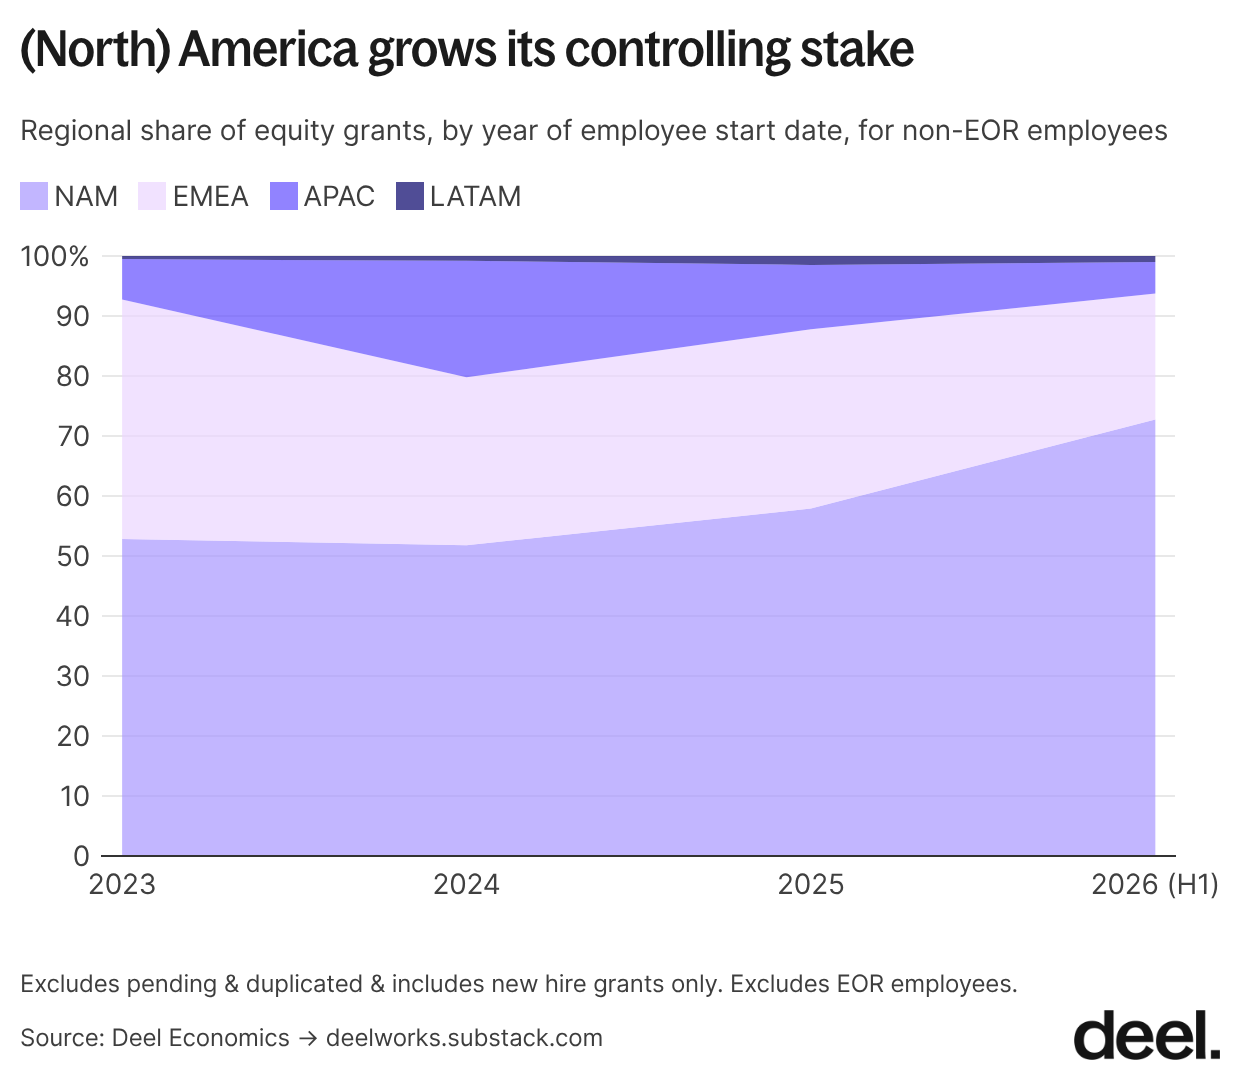
While we’ve excluded independent contractors from this analysis because their equity process differs substantially from employees, including them here would make this trend even more obvious
To check whether this diversification is real and not just a shift in Deel Equity's customer base, we looked at the share of new starters granted equity at each Deel Equity-using organization.
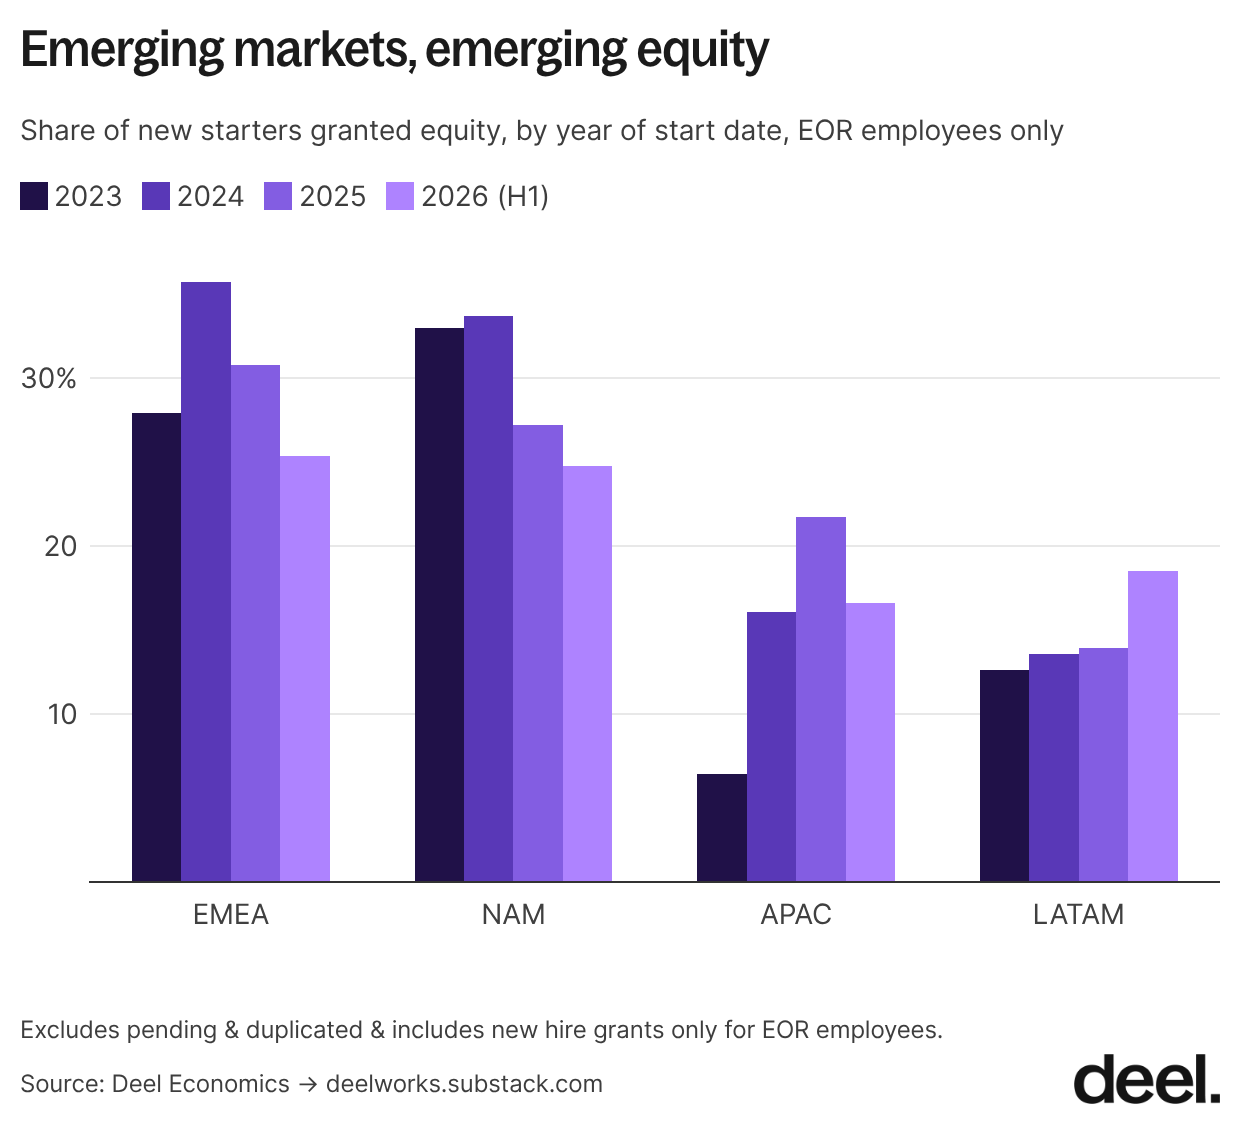
The chart above shows that EOR employees in North America and EMEA are the most likely to be granted equity, with 34% of North American employees and 28% of EMEA employees receiving equity in 2023. Both regions peaked in 2024 before declining thereafter.
More interestingly, the share of APAC and LATAM starters receiving equity grants has risen over time: from 6.5% in 2023 to 16.7% in H1 2026 for APAC (statistically significant, p < 0.01), and from 12.7% to 18.5% for LATAM.
North America has gone from being the clear outlier in equity grant likelihood to looking much more similar to other regions. This suggests that equity compensation, once concentrated in a handful of historically favored markets, is now reaching a broader and more geographically diverse set of employees.
Amongst employees hired outside of the EOR product, the story looks a bit different. North America is the clear winner here, although the gap between North America and other regions has narrowed since 2023.
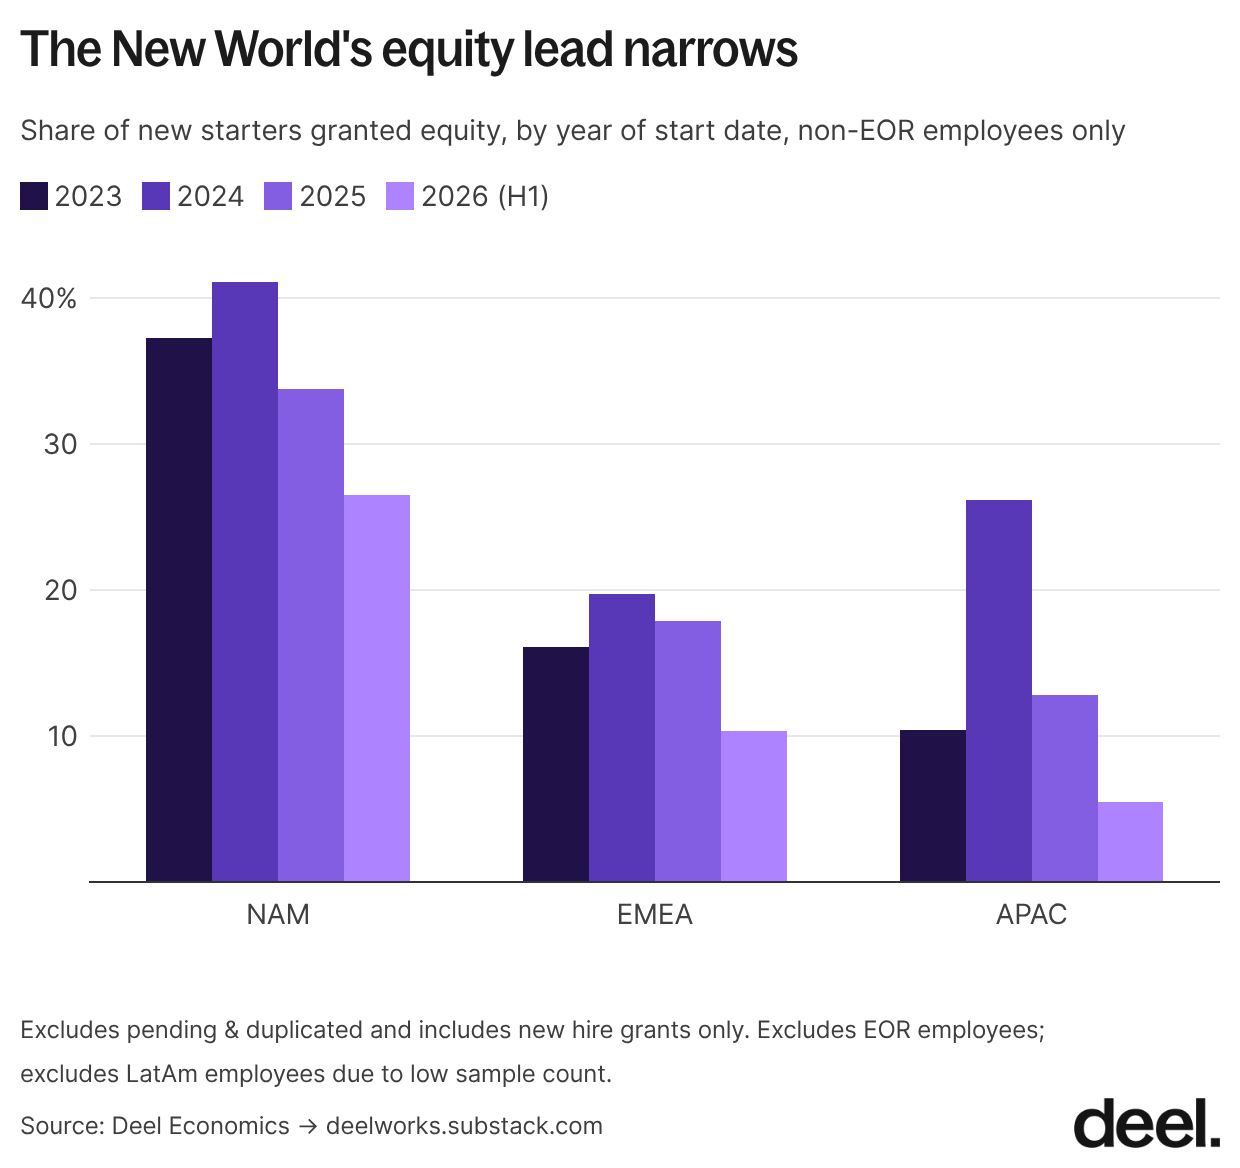
US-headquartered companies are the most likely to issue equity
Why does North America dominate non-EOR equity, but the same pattern doesn't hold among EOR employees? The likely answer is where the company itself is headquartered. Many EMEA-based EOR employees are hired by US firms, and the reverse is true for American EOR employees, whereas non-EOR products tend to follow the opposite pattern. That's because only American legal entities can hire employees in the US outside an EOR product.
Many of those American legal entities, in turn, are owned by US-headquartered companies. Equity has long been a form of compensation in the US, and we suspected that companies headquartered there have begun carrying this over to their employment practices elsewhere.
US companies dominate the grantor list
We checked each headquarters country's share of companies ever using Deel Equity against its share of companies ever active on Deel overall. US-headquartered companies dominate the list of Deel Equity users, and among the eight most common countries on Deel Equity, they show the largest gap: 12 percentage points more of Deel Equity users than of Deel's overall company base. Israel is the only other country that's overrepresented by this measure.
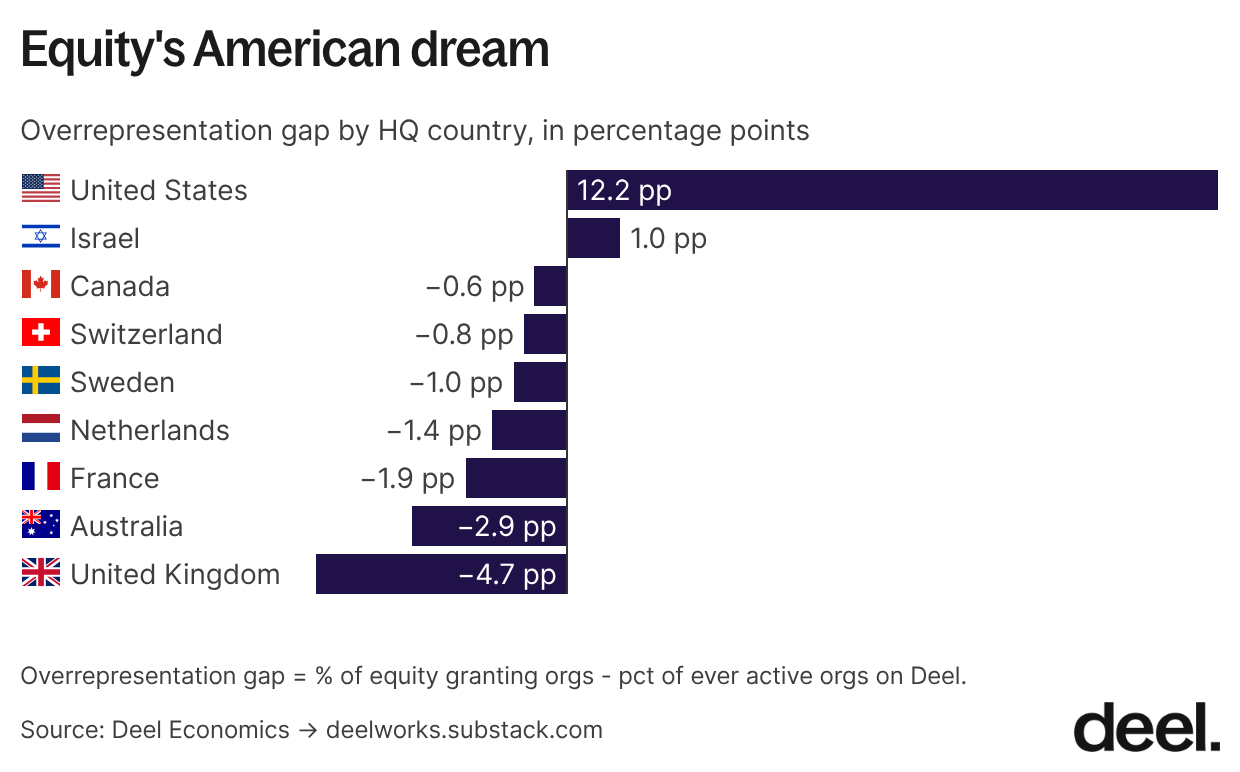
The same pattern holds when looking at tech companies alone.
They also grant to more of their workforce
For each equity-using organization, we calculated the share of each equity-using organization’s ever-active employees who received an equity grant, then averaged that share across organizations grouped by HQ country. All countries with fewer than 50 employees or 10 companies receiving grants were excluded from this analysis.
Israeli- and US-headquartered companies showed the highest average share, at just above 45%, ahead of companies headquartered in Germany, the UK, France, and the Netherlands.
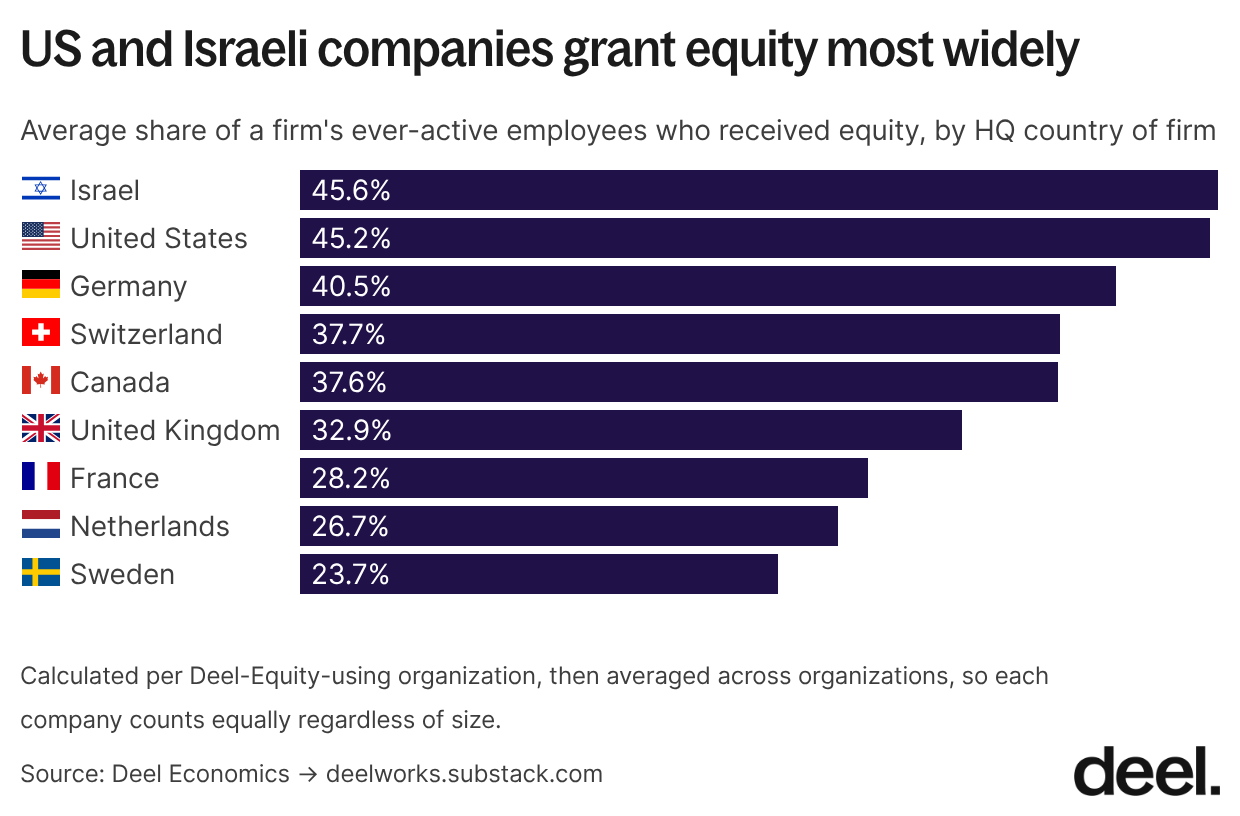
We see the same pattern amongst employees of AI companies: the average share of US-headquartered AI companies that have received equity grants through Deel is 49.8%, versus only 31.7% in UK-headquartered AI companies.
The countries pulling ahead
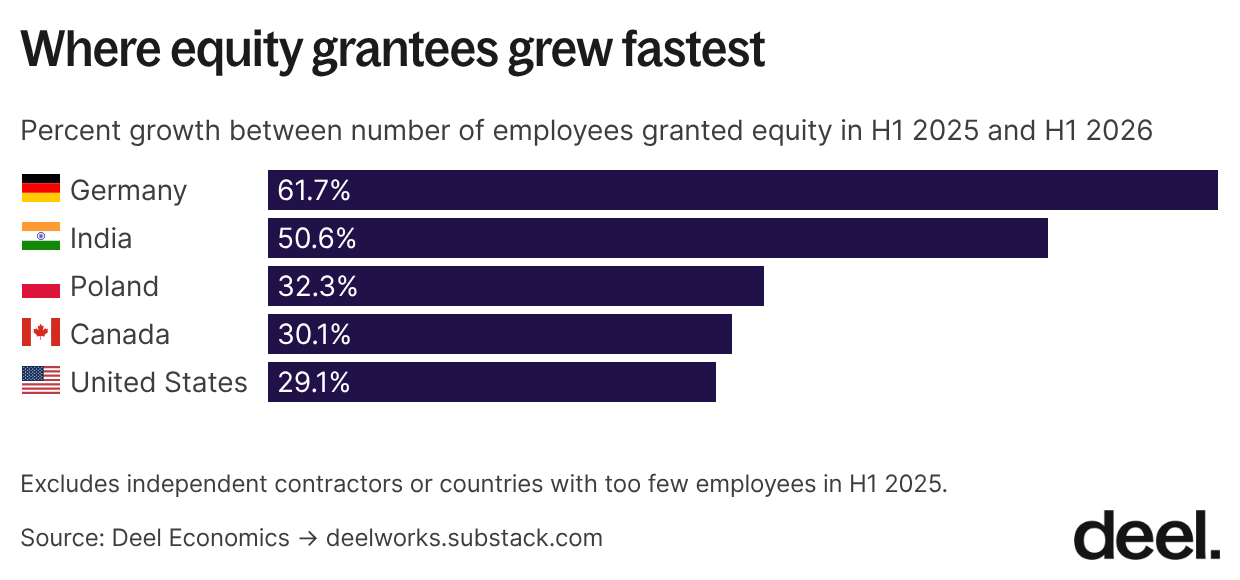
Between H1 2025 and H1 2026, the top-growing countries for grant volume are Germany, India, Poland, Canada, and the US (excluding countries with too few employees in H1 2025). But some of this could be shifts in Deel’s customer mix rather than a genuine growth in grant-giving. To check, we looked at a fuller window — the share of new starters receiving grants between 2024 and 2025 — where Germany still leads, followed by Italy, France, Sweden, and Switzerland.
Why does this matter?
American tech’s rise has been a source of grumbling elsewhere in the world - with some concerned that non-US countries get to watch the AI boom from the sidelines without a share of the upside. But this data is a reminder that it's not zero-sum: US tech companies hire outside the US (both through EOR products and through their own local legal entities), and in doing so, they carry equity along with them. London is a case in point, one of the biggest tech and finance bastions in the world thanks not just to homegrown success stories but also to the European headquarters of companies founded elsewhere.
Labor's share of national income in the US has been falling for decades. But a good chunk of that decline can be explained by workers, especially highly skilled ones, increasingly being paid in stock and options rather than wages.
Outside the US, legal and tax frictions have long kept workers from benefiting the same way, though that's starting to shift. Our data suggests legal changes and products like Deel Equity have made equity a bigger part of pay outside the US, too.
Still, worth remembering: this is a small group of employees, nowhere close to representative of the countries they live in. This isn't a panacea.
Customer-facing roles on the rise
Now let’s swap axes and look at role instead of geography. The same widening pattern shows up, and equity is starting to reach sales and marketing hires now, rather than purely technical roles.
Below is a chart showing the share of all grants going to each occupation grouping within the subset of EOR employees.
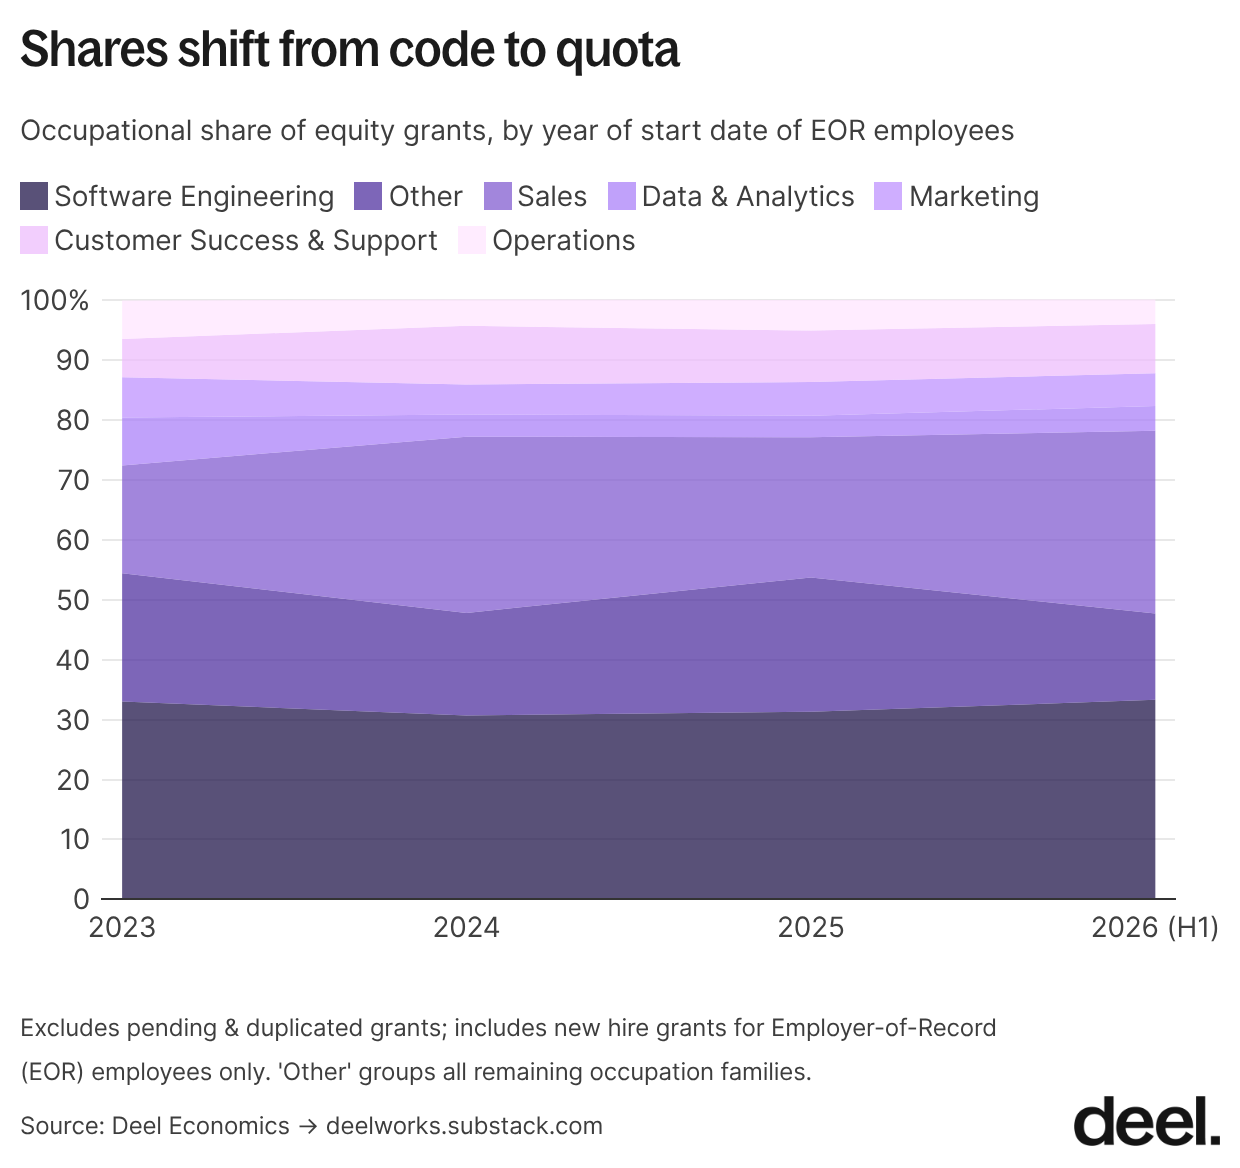
Software engineering's share of grants fell from 34% in 2024 to 30% in 2025, before picking back up in H1 2026 — though it's too early to tell if that rebound holds. The bigger story is sales, which climbed from 18% of grants in 2023 to 27% in H1 2026. Customer Support & Success has risen more modestly over the same period.
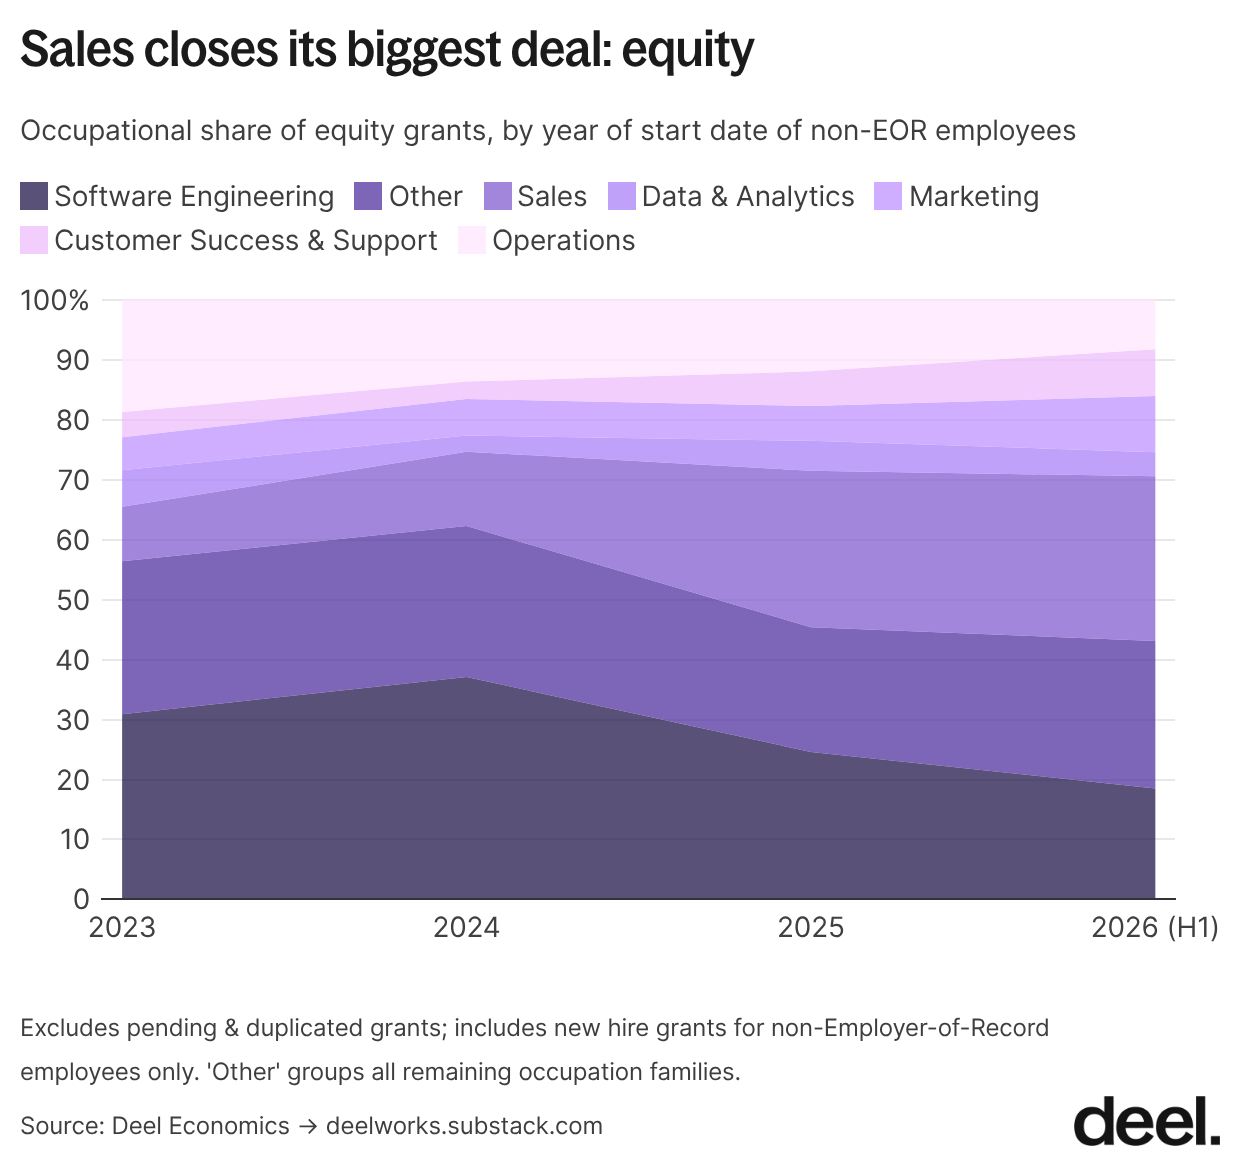
Among non-EOR employees, this shift is even more pronounced. Software engineering has clearly declined as a share of all grants, while both sales and marketing have grown: sales rose from 10% to 28% of new grants, and marketing roughly doubled, from 4% to 8%.
To control for shifts in customer composition, we ran the same analysis as in the previous section: the share of new starters at each Deel Equity-using company, within a given occupation, who received a grant. Software engineering remains the single most popular occupation for equity grants, but other roles are closing the gap.
Amongst non-EOR employees, the shift is clear: customer success and sales have risen sharply from low bases, up 17 and 15 percentage points respectively between 2023 and 2025, while software engineering has drifted down.
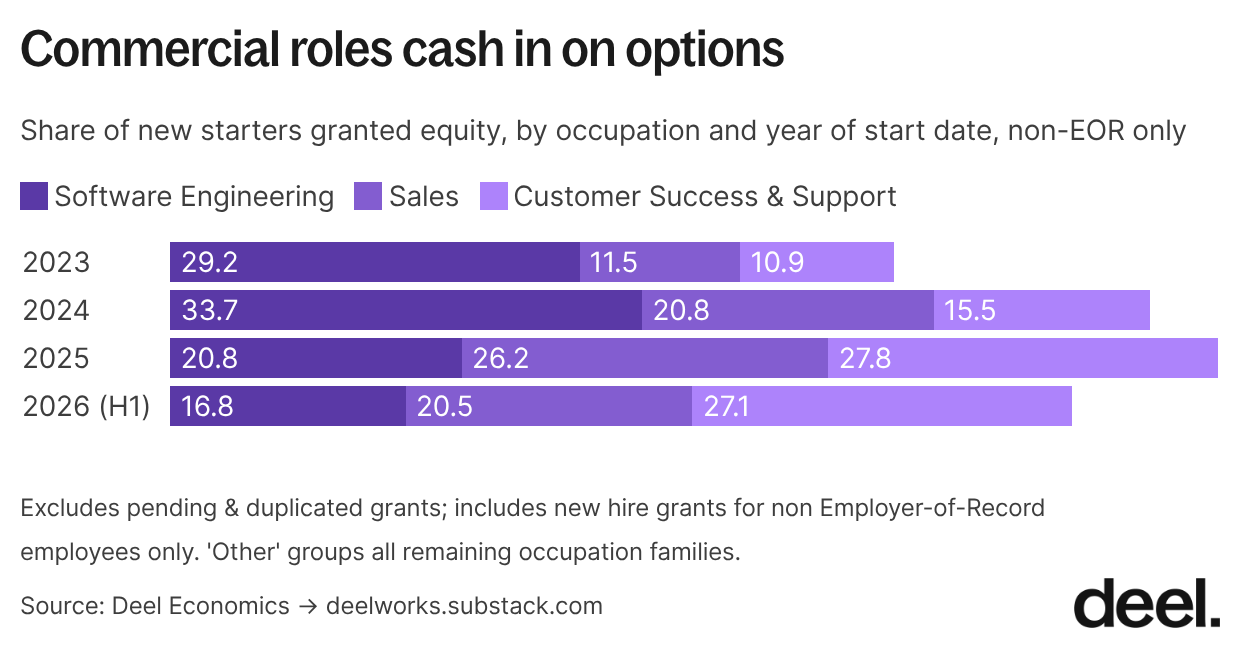
Among EOR employees, the picture is more difficult to untangle. Engineering still leads, but its lead has thinned. The share of new engineering hires receiving a grant was essentially flat between 2023 and 2026, at 29%, while sales rose from 24% to 27% and customer success from 15% to 20%. Engineering's margin over sales fell from five percentage points to under two.
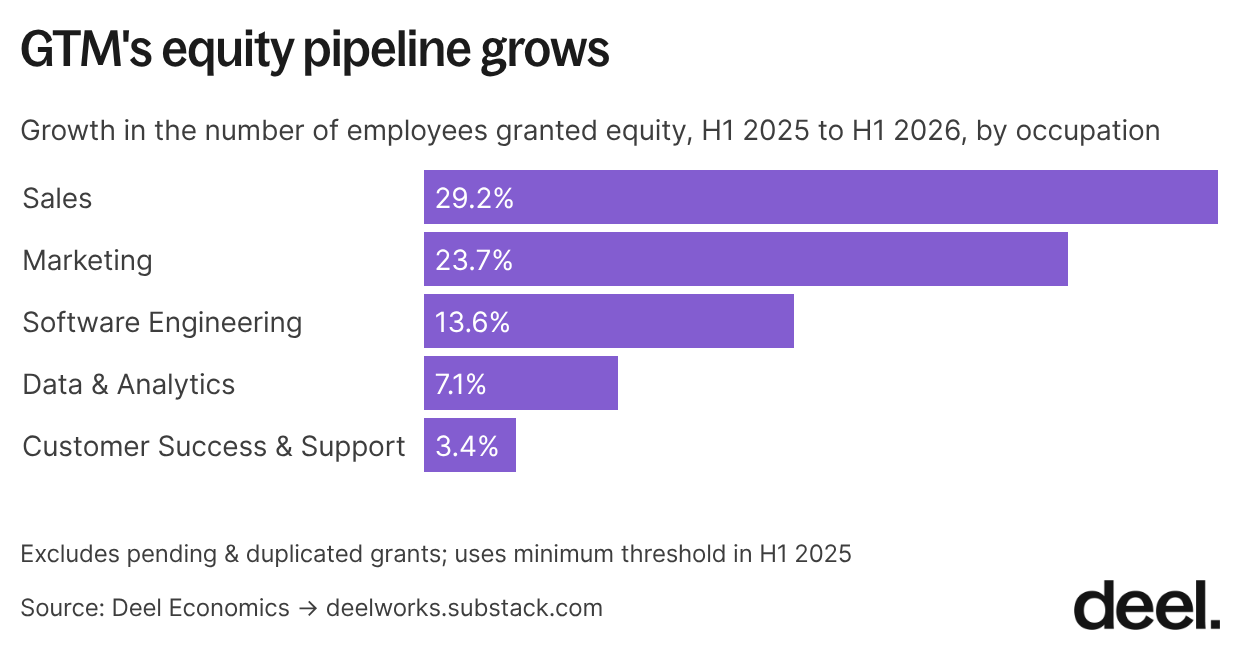
Looking at growth rates specifically, sales and marketing roles grew fastest between H1 2025 and H1 2026 — outpacing the technical roles of software engineering and data & analytics.
Equity is slowly going global, reaching more countries, industries, and roles than it did just a few years ago. Whether that trend continues will say a lot about how broadly the gains from AI and tech ultimately get shared.
For more chart deep dives like this one, subscribe to Deel Economics on Substack.
Methodological notes
Data source and coverage
All figures come from anonymised and aggregated Deel platform data, drawn from the Deel Equity source table alongside Deel's contract, organization, and worker tables. The sample size initially consisted of over 13,000 employees - 9,000 was the figure after all cleaning and exclusion criteria were applied (including removing independent contractors or pending grants).
Grant records can begin before the launch of the Grant Equity product in January 2023 due to backfills. Every grant is assigned an event date, defined as the grant date where present and the vesting start date otherwise. Test/duplicate or internal Deel grants are excluded. Only non-pending grants are included.
Linking grants to contracts
Each grant is matched to a single Deel contract; to protect worker privacy, personal identifiers are removed, and only the following attributes are assessed: worker's country of residence, region, occupation, contract type, and contract start date, along with the organization's headquarters country and industry. Where a worker holds more than one contract, we prefer a contract that began on or before the grant event date, then take whichever contract start date sits closest to the event date.
Contract types
EOR refers to employees hired through Deel's Employer of Record product. Non-EOR employees are those employed by Deel’s clients on global payroll, HRIS-only, and PEO contracts. Independent contractors and contractor-of-record arrangements are excluded throughout, since equity issuance to contractors follows different legal logic and isn't comparable.
Classifying AI and tech companies
The AI classification was produced by running each organization's description, keywords, and founding year, together with the text of its homepage, through Claude Sonnet. The two-part test described earlier in this piece is the instruction the classifier uses. We also count a company as AI where its primary domain ends in .ai. A manual validation of 100 randomly sampled companies from Claude's AI-native classifications showed 87% precision. A separate validation of 50 randomly sampled companies across all tiers confirmed 91% sensitivity.
Tech companies are defined by their internally assigned industry, covering custom software services, technology and information services, data collection and internet portals, and artificial intelligence.
Occupation groupings
Occupations come from Deel's internal occupation taxonomy (built by yours truly!), which maps a combination of job title, job description, and company industry to a custom-built occupation taxonomy, based on the European Commission’s ESCO taxonomy. The role charts report six groups: Sales, Software Engineering, Data and Analytics, Marketing, Operations, and Customer Success and Support, with everything else collapsed into an Other category. Grants where no occupation could be assigned are excluded from the role analyses but retained elsewhere.
Time periods
The regional and occupational analyses cover contracts starting between January 1, 2022 and June 30, 2026. The analysis of how many countries an organization grants into runs on grant event dates from January 1, 2021 to June 30, 2026, grouped into half-year periods, and covers EOR employees only. For each organization in each half-year, we count the distinct countries of residence of the employees it granted to, then average across organizations. The multi-country version of that average conditions on organizations granting into two or more countries in the period.
All 2026 figures cover the first half of the year only.
Defining grants
Defining new-hire grants: We include any equity grant explicitly labeled as such, or issued within 12 months of the recipient's contract start date. Grants are assigned to a year based on the employee's contract start date, and to a region based on the employee's country of residence rather than the company's headquarters country.
Defining the share of new starters who received a grant: the numerator counts distinct people granted equity; the denominator counts distinct workers who started a contract in that period, restricted to organizations that appear somewhere in the grant data. Restricting the denominator this way holds the set of equity-using companies fixed, so a change reflects those companies granting more or less widely rather than a change in who Deel serves. Both sides are keyed on contract start year.
Denominators are built separately by region, by country, and by occupation. Because people move between countries, combining them into a single table would double-count some workers, so they're kept apart deliberately.
Lauren Thomas is Deel's founding Economist, where she’s helping to bring Deel’s mission of breaking down geographic barriers to opportunity to life through data — a mission that resonates personally, as she's worked and studied in six cities across three countries!
Before joining Deel, Lauren worked in economic research and data storytelling at the Federal Reserve Bank of New York, Glassdoor, and Stripe. She has degrees in economics and data science from Oxford, Université Lumière Lyon 2, and Northwestern University.
Outside of work, she enjoys reading, playing volleyball, climbing, sewing her own clothes, and using Oxford commas. She does not enjoy long flights but takes a lot of them anyway!